How to Accurately Track Users and Visitors on Your Site
 ContentPowered.com
Running a business online requires a lot of attention. One of the most attention-heavy aspects of it all is analytics. You need to know what’s going on with your website and your web business if you want to have a chance at improving it. Sure, you can just throw traffic at it in ever-increasing volumes, but that’s a poor use of both time and money.
Think about it this way. If you have a 5% rate of sales, that means 5 out of every 100 people buy your products. That’s fine; you decide to advertise until you get 200 visitors. At 5%, that gives you 10 sales; a double in profits. It doesn’t scale all that well, though. How many times can you double it? 400, 800, 1,600, and on and on. It costs more and more to reach and attract those people, and you have to broaden your net to catch anyone you possibly can. Your volume goes up, and your profits rise based on that, but your conversion rate drops. 4%, 3%, 2%, until you’re at the point where getting more people won’t do anything but suck away your ad budget.
Instead of throwing people and money at the problem, you can look into the statistics on your site. Where are people coming from? Which referrers send the most likely conversions? What demographics make up your readership? When they’re on your page, what do they do? When they think about converting, what stops them?
In every sales funnel, there are roadblocks. If there weren’t, you would have a 100% conversion rate, and that never happens. By studying your analytics, you learn what those roadblocks are, and you figure out how to fix them. That can help you boost from that 5% to higher, so you don’t need to get more visitors to get more profit, and you can get more profit from more visitors. So, what can you track, and how can you track it?
For the most part, this article will be talking about using native tracking from within Facebook, and tracking on your site using Google Analytics. There are other analytics suites out there, like Raven Tools, Coremetrics, or Microsoft’s new Cortana Analytics. Many of them will function in the same way, or at least provide the same data. Feel free to adapt the instructions I give to your own favorite analytics software.
Tracking Demographic Information
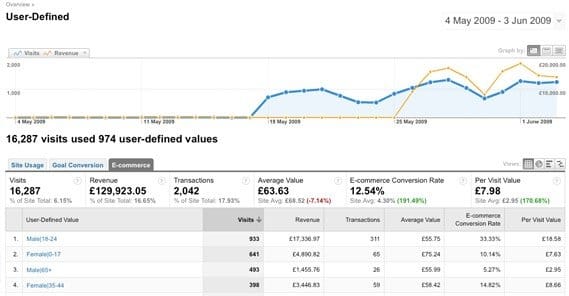
Demographic information is some of the most basic valuable information you can find. It guides virtually every aspect of your business, from your marketing efforts to what products you might have in R&D. If you’re making athletic gear for young men, but find out that your marketing is most effective at targeting Latino women, you have a choice to make; do you change your marketing, or do you cater to your new demographic? Without analytics, you might never know that’s a question.

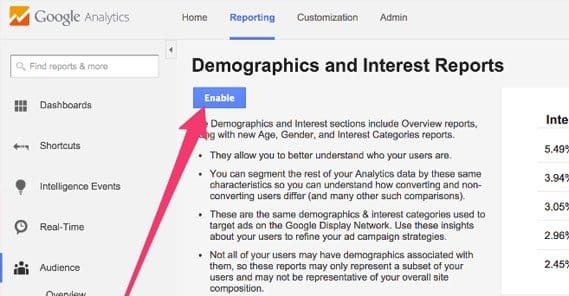
In Google Analytics, there are specific reports for demographics and user interests. This is information tracked by Google from around the web via their Display Network. It’s all anonymous – it goes by cookie, not by any username or personal identifier – so no one can exploit it on an individual basis. To enable these reports, you need to make sure your Analytics version will support advertising features.
To enable these reports, sign into your Google Analytics dashboard and click the Admin tab. In this section, find the account and property where you want to use demographic information. Under Property, click settings, and find the “advertising features” section. There will be a section labeled “Enable demographics and interest reports.” Set that to On and click to save the settings.
You’re not done yet. That just enables tracking. Now you need to create a report. This time, go back to your property and click view. Click the Reporting tab, and open a new report for Audience, Demographics, Overview. This report won’t have data yet, because Google Analytics doesn’t provide realtime updates. You will have to wait a day or two for information to start rolling in and even longer to get a statistically relevant sampling of your audience.
This will get you quite a bit of data, but it’s not going to be the deepest or most robust data you can access. For that, you will need to use Facebook.
Now, Facebook isn’t going to install analytics on your website. We’ll be using an on-site installation later, but it won’t be tracking demographic information. To do that, you need to build an audience on the social network. Your goal is to get as much of your audience as possible to follow you on Facebook, or at least visit your Facebook page, so their information is recorded in your Insights.
Facebook Insights is an incredibly robust data harvesting engine with one major limitation; it only tracks data on Facebook itself, with the exception of the conversion tracking pixel we’ll talk about later. As you grow your audience on Facebook, you will get an incredible amount of demographic and interest information, all of which you can use for targeting ads, guiding your organic marketing, and developing new products.
You don’t have to do anything special to implement this tracking; just know it exists. All you really need to do is make sure you’re growing your audience on Facebook, and that the audience you’re growing on Facebook is the same as the audience that reads your website.
Tracking Basic Google Analytics Metrics
It’s easy to fall into a trap with Google Analytics. It tracks a lot of data, but some of the most valuable data is hidden behind obscure reports and is hard to parse, while some of the data it presents to you up front is not all that valuable. It’s nice to see the number of visitors to your site, but does it really matter? No. I could pay some guy on Fiverr to deliver 100,000 hits to your website and that number would skyrocket, but who cares? None of those hits turned into purchases, because they were all made with software. Heck, if you’re using CPM ads – the kind that pay per view rather than per click or purchase – you could even get banned from your ad network for it.
So what metrics should you track and pay attention to? Here’s some ideas.
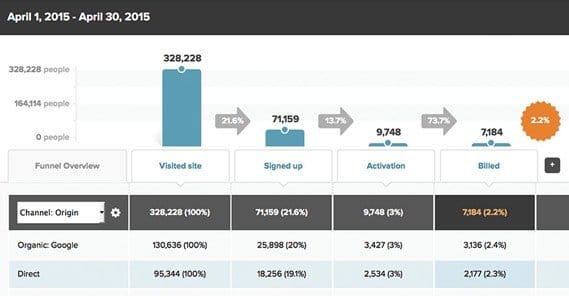
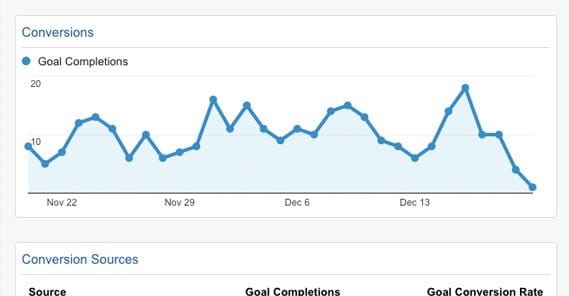
- Where your traffic is coming from. How much of your traffic comes from social media versus direct sources versus website referrals versus search results? You can use this metric to see if there’s a weak point in your marketing, as well as to measure conversion rates per traffic source rather than just in general.
- Conversion rates for different categories of traffic. You can segment your traffic via a bunch of different metrics and see the conversion rates for each. Traffic source is one option, but you might also consider traffic that converts on the first visit versus traffic that converts as returning users. Returning users are great to target, and that’s part of what we’ll be looking at with Facebook conversion tracking later.
- How many points of engagement does a user make while on your site? According to Google, a point of engagement can be just about any action a user takes. These include link clicks, items added to cart, conversions, social shares, form fills, and others you can set yourself.
- Bounce rate. Bounce rate tracked through Google Analytics is tricky, which is why I have a whole section dedicated to it.
- Costs per various metrics. Organic marketing costs money, to write blog posts, advertise socially, and so forth. Paid marketing also costs money, through paid ads, sponsored links, and the like. How many visitors do you get for $1 through various methods? How much money does it cost for one conversion, through various sources?
- Value per visit. Not every user who visits is going to buy, but depending on the ways you make money, they can earn you some on the side. There’s more to it than just average cart value, though. How many users need to visit before one converts? Spread the value of that conversion out between them to see an idea of how valuable each user is, and segment it by traffic source to see which sources are most valuable to you.
- Entry and exit locations. What are the landing pages when people find you? Are they paid landing pages or are they organic blog posts or product pages? What pages are users on when they leave? Are there pages that are problematic and drive users away, or are most of your users content to read a blog post and leave until next time? If most of your users are abandoning shopping carts at a particular page, there might be a problem you can solve.
Tracking Visits and Bounce Rate (Accurately)
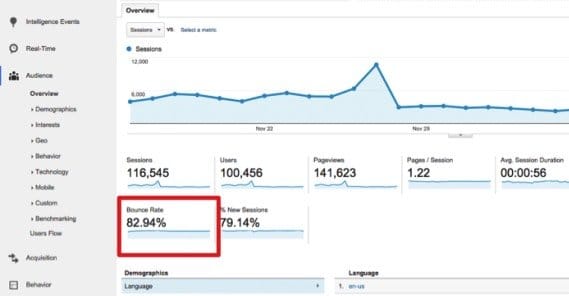
As I mentioned, bounce rate is something that Google tracks in a fairly unique way. The basic definition of a bounce is simple; a user who landed on your site and then left quickly without doing anything. It seems simple to track that, right? Well, the problem is that’s not how Google tracks it.
To Google a bounce is a visit with only one engagement hit. There are a bunch of different types of engagement hits, including social shares, pageviews, ecommerce hits, and more. You can read a bunch about them here.
 How to Tell Which of Your Pages Land the Most Sales Chances are, people arrive to your site…

Worse, Google has expiring sessions, and doesn’t do very well when tracking extended visits. If a user lands on your page and triggers a pageview hit, that’s the natural start to any browsing session. If that user then gets distracted and leaves the page for a few hours, the session expires. Then they come back, keep reading, move on to another page, then another, then buy something. To Google, that looks like a brand new session, but it’s direct traffic, because the user started on your page with no referral data. Even if they came from a referrer, it looks like the user who landed from the referrer bounced, because they didn’t interact. Even though they’re the same user, the session gap records both a successful conversion and a bounce.
This can cause problems in stat tracking if you have automatic hits, like an autoplay video or a live chat invitation on a timer. Each visitor gets a pageview hit and a video view hit, or a pageview and a live chat hit, which disqualifies it as a bounce. Therefore, your bounce rate will look a lot lower than it is.
Another problem with bounce rate is that a bounce and a satisfied user look a lot alike. If I come to your blog via Google search, read the article, enjoy it, and leave, what do you see? You see a visitor that arrived, then left without engagement or continued browsing. In other words, a bounce. Even though I liked the blog post and got a lot out of it, it isn’t reflected in your analytics.
One way to minimize that is to encourage engagement via comments or social shares, but it’s hard to do that, and even the best rates will still be under 15%.
Bounce rate in general is tracked accurately in Google Analytics. The problem is that people fail to understand exactly what it is. You simply need to understand it, and realize that it’s not always a useful metric.
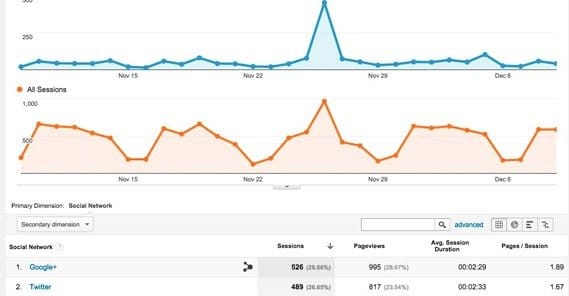
Tracking Social Media Referrals
This is going to be a short section, because we’ve written about the process somewhat extensively before.
Google provides a URL builder that adds UTM parameters to the end of any URL you feed through it. These parameters don’t affect your SEO in any way, but they can be used in links – both organic on social networks and paid through ads – to bring more data than just referrer. If you get a user hit from Facebook, was it from a post you made, a profile link, or an ad? Without UTM parameters, you have no way of knowing.
There are a bunch of different ways you can use those parameters, but we’ve covered them before. I recommend reading that post so you get a good grasp on what they are and how they work.
Tracking Conversions from Facebook Ads
Facebook offers a bit of code called the tracking or conversion pixel, which is a somewhat archaic name taken from when sites would embed single pixel images that triggered events on page load, so they could track page loads based on how often the pixel image was loaded.
![]()
The conversion pixel is a snippet of code you put on the confirmation page of a conversion, for example, a “thank you for signing up” page on form submission, or a “thanks for buying” page after a purchase.
You can use this pixel in a few ways, all of which are by having data provided in Facebook Insights. It tracks users so that you can advertise to people who visited but didn’t buy, or even target just converted users with accessory upsells, or what have you. Like UTM parameters, we’ve written about using the pixel before, so I recommend you check that out.
Tracking User Behavior On Page
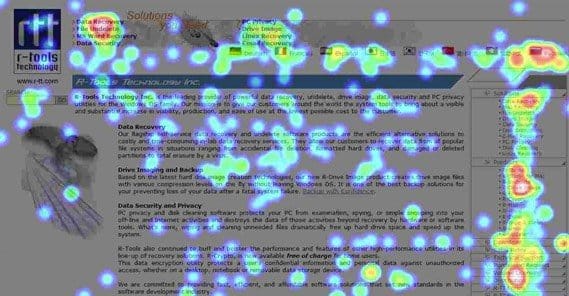
This bit of on-site data comes from a heatmap app. See, even with Google’s event tracking for bounces and whatnot, it still only triggers when discrete events happen. There’s no difference between someone spending half an hour reading your post and someone closing their browser when the title loads.
There’s another similarity issue; if you have a landing page with three different CTA conversion links, which one is the one users are clicking all the time? You have no way of knowing. UTM parameters could help, but they’re an inelegant solution to the problem. Instead, I choose to use a heatmap.
A heatmap is essentially a bit of tracking code that monitors data about user behavior passively. It might record the coordinates on your page each time they click, or the monitor position to see what they’re reading. The only thing it can’t track is eye movement, because you need users in person to track that.
Heatmaps are very visual representations of how users use your site, and can help you identify problems with site design. If a button looks too much like an image, people won’t click it because they don’t know it’s a button. Conversely, if an image looks a lot like a button, people will click it expecting something to happen. You will also be able to see things people think are buttons, which gives you an opportunity to turn them into buttons for added benefit.
There are a bunch of different types of heatmaps, so it’s up to you to pick the ones you think would be most useful.
Now, all of the above is just scratching the surface of how you can use various forms of analytics to track your customers. The sky really is the limit here; there’s so much you can track, so much you can compare, that you can lose yourself in analytics and never actually make tests and changes. Don’t let yourself get caught up in the data so much that you don’t try to improve. The important thing is change over time. Make a change to your site and see how your metrics improve or don’t. Use your analytics, don’t just treat them as a curiosity.
Written by Kenny Novak

Kenny is an SEM and SEO professional. He uses blogging and content marketing as a launchpad for small businesses looking to grow their online presence.