What is The Difference Between Hits and Pageviews?
 ContentPowered.com
This is a question I see occasionally, but primarily not one that most people even realize is a question. What do I mean? Well, when I say you got a hit on your website, you assume that means one person visited your site. If I tell you your site got a pageview, you assume the same; one person visited your page.
Now what if I told you that one pageview might actually be anywhere from 5 to 10 to 50 different hits all rolled into one? You might start questioning it. You might assume my idea of a pageview is more of a session, and that each page the user loaded was a hit in that session. Unfortunately, you’re going in the wrong direction. Rather than expanding what a pageview is to encompass multiple hits, you have to shrink what you think of as a hit.
What is a Hit?
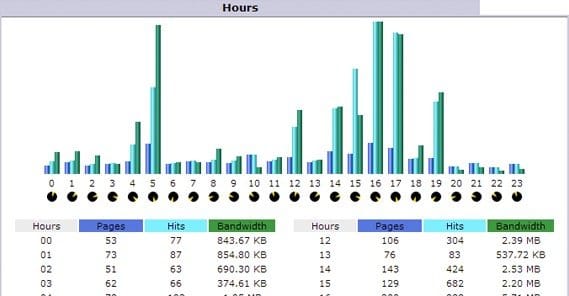
A hit, as measured by most analytics programs, is each time the server is queried. Every server request, large or small, is a hit.
How, this doesn’t seem too strange, right? A user types in your URL, their browser sends a request to load your site, your site loads, that’s a hit, right? Not quite.
See, the way the web works is that the communication between a client browser and a site may actually be a number of back and forth communications. They ping your server for a response and it says it’s alive and okay. They request your website and your server sends the basic html. It reads the html and sees three scripts at the top – for analytics, a hello bar, and a heatmap, say – and it sends your server three more queries, one for each of them. It sees that you have fifteen images on your site, and sends queries to load each one of them. It sees a few more scripts, calls to CDNs, and all the rest of that stuff.
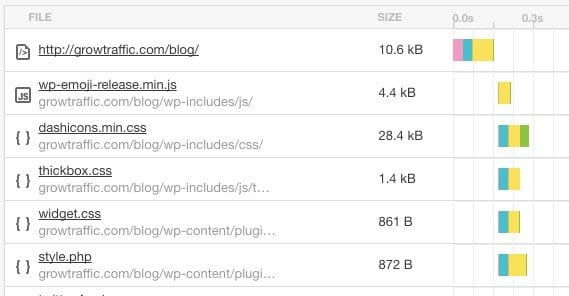
All in all, one user visiting your site could be loading 10, 20, 30 different elements. Scripts, images, individual script files, CSS files, anything external that’s hosted on your server is a hit on your site. Items hosted on CDNs are not hits on your site, but they are hits on the CDN.
Now take a look at the site you’re on now. How many hits do you think one user would generate from one view? Now go take a look at Google’s search homepage. It’s a lot sparser, right? A lot fewer elements to load, and thus a lot fewer hits.
If you’re interested in legacy, hits are a relic of the era of logfile analysis, where your only means of seeing what happened on a site was to check the log files of what was requested by who and when. It’s a very old metric, and frankly should be dropped from all but the most specialized tools these days.
What is a Pageview?
Now, that whole process I wrote out above? Where the user submits their query, the server responds, and the back-and-forth happens to load all of the elements in different hits? All of that, together, once the page loads, is called one pageview.
This means the “value” of a pageview in hits can vary wildly. One pageview to Google.com might be worth a half a dozen hits, more or less depending on dynamic elements in their doodle, additional support ribbons, and so forth. One pageview to this site could be 20, 30 hits. One pageview to an image-heavy gallery page could be 50 or 100 hits.
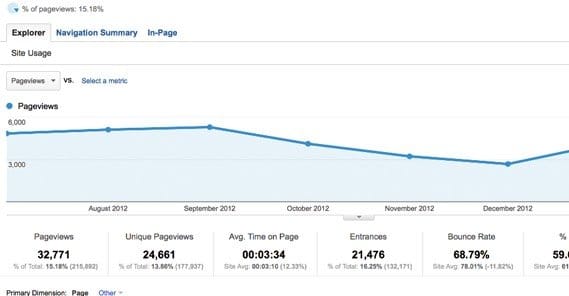
Pageviews can be divided into simple pageviews and unique pageviews. Raw, simple pageviews is just a count of the number of times a page on your site is loaded, generally by tracking the loads on your analytics code. Unique pageviews counts the number of times different pages are loaded. A user who refreshes your page, perhaps because something broke, or because the page is loading slowly, or an element didn’t load properly, is generating more than one pageview of the same page. They have one unique pageview but X=number of refreshes raw pageviews.
Hits are Worthless
This is the problem we run into. The idea of hits as the actual definition stands is valueless. When one pageview is worth such a varied number of hits, the idea of counting hits or even making them a meaningful metric is just laughable.
That’s just the thing, though; virtually nothing actually tracks hits in that way. Even those old Geocities-era hit counters were actually counting pageviews, or rather, individual hits on that one specific element of the hit counter, which would occur once per pageview.
This is what primarily led to the conjoined definition of hit and pageview. People think of one pageview as one hit, because when measured that way, they’re functionally the same.
Hits are not used in their original definition, at all, by anyone, for general analytics. The only reason to look at hits is if you think your website is slow because it’s loading a lot of different elements. You can reduce the number of elements and reduce the number of hits, which will generally improve your page speed, though perhaps not by very much. It doesn’t take long to download a CSS file, after all.
 How to Accurately Track Users and Visitors on Your Site Running a business online requires a lot…

Other Related Terms
There are other view-related metrics that you might encounter in reading your analytics. I’ll go over them individual here, just to show you how much more confusing it can be.
Impressions, for example, is another term that generally means the same thing as pageviews. An impression is a view, but it’s a little different in connotation. For one thing, impressions are a marketing term more than an analytics term. They’re generally used as part of pay per view advertising, as part of PPM. PPM, or pay per mille, means pay per 1000. Impressions then are typically lumped in groups of 1000.
Impressions, however, can also refer to specific elements on the page. People don’t care about the number of views your site as a whole gets, if, say, the element they want viewed is below the fold. They want actual impressions on that element, which could vary. Or, for example, if a bunch of users of your site have Flash disabled, and thus flash content gets fewer impressions than your site gets pageviews.
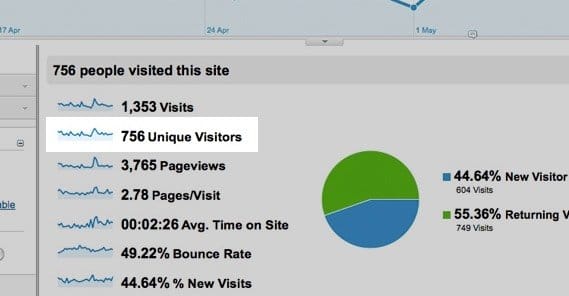
Another metric is unique visits or visitors. One user is one visitor. One user can generate multiple pageviews, impressions, and hits. One user, browsing your site all day, will only be one unique visitor. This is a fuzzy metric too, though it’s generally pretty accurate. Three different people using the same computer to visit the same site is still called one unique visitor, because the website has no way of differentiating between them unless it has a login function and they all log out of each other and into their own accounts. Generally this is recorded via IP address, too, which means browsers with rotating IPs or using proxy lists can be one person triggering multiple visitor records. This just means there are two forces dragging the number out of balance in different directions, balancing each other out.
A session is another metric you’ll see fairly often. It’s an accumulation of the actions a user takes while they’re on your site. All of the views the user has made, all of the hits they’ve made, all of the elements they’ve loaded, all of their impressions; these are grouped together as one session. One user can have multiple sessions in a given day, as well; most analytics software has a timeout for ending a session, usually a half an hour. If the user leaves and comes back, or goes idle for 30+ minutes, they start a new session when they return. Sometimes you can track users across sessions, but this typically requires using cookies. This metric is also occasionally called visits; one visitor can visit your site several times, each time generating a new, unique session.
Clicks are yet another metric, and they’re used in a few different ways. Google Analytics and other basic analytics apps will use clicks to record element clicks a user makes. Clicking on a link, internal or external, is a click. Clicking on an image to expand it, a social button to share a post, a video to play it, an ad; these are all individual clicks. One user can have a ton of different clicks in their session.
Clicks have a slightly different meaning when tracked by something like a heatmap, however. These apps track each time the user actually clicks their mouse while on the page. If they click and highlight text as they read, these are clicks, even if they don’t interact with a link or other element on your page. This sort of click tracking is important for seeing elements on your page that users think are links or otherwise interactive, but do not do anything when clicked. Essentially, you can identify hotspots of missed opportunities using a heatmap. We even covered using that to optimize your sales.
Referrals are a semi-related form of metric, but it’s really supplementary data. Referral data is data about where the user came from when they arrived at your site to generate a pageview and start a session. This is tracked in a variety of ways and gives you more information about which of your traffic generation sources is performing in what manner.
Engagement is another metric you can record, and counts things like comments and shares on your content. Likes, comments, and shares are the main forms of engagement, but it’s also a fuzzy metric, but more on that in a moment.
Derived Metrics
On top of all of this, there are a lot of metrics that take each of these into account. For example, you might want to calculate how many people convert. You can take the number of conversions and divide it by the number of unique visitors to see how many people convert, percentage-wise. You can compare virtually all of these metrics to each other, and to other metrics like conversions, costs, and so forth.
All of these are called derived metrics because they’re derived from an equation using multiple pieces of data. This is in contrast to the metrics I listed above, which are generally just called recorded data or tracked metrics.
Difference in Definition
One thing you have to watch out for is issues with different definitions between different analytics platforms. For example, Facebook Insights will track a lot of this data for your ads and organic posts on your page.
Engagement, as listed above, is a metric recording the actions a user takes that interact with your content. You would think you could add up the number of likes, comments, and shares on a post and get your engagement, but you often find that your recorded engagement is much higher. This is because any click interacting with your post is considered engagement. This includes clicking a “read more” link, or just clicking your link in general. It also includes clicking to change your reaction to a post, clicking to like a comment on your post, or clicking through to your page. It makes deriving metrics from your engagement rates on Facebook a tricky prospect.
At the end of the day, everything is a little fuzzy. Most of these definitions are what they are because that’s what Google Analytics uses, and in order to be cross-compatible with Google Analytics, other tools use the same definitions. When one system changes it up, it can lead to errors in reporting, bad data, and issues with accuracy.
What matters, then, is not so much the exact definition of any of the metrics, so much as it is knowledge of what the analytics software recording the data uses. It’s like slang. Knowing the dictionary definition doesn’t help you when everyone else uses the word in a different way.
Written by Kenny Novak

Kenny is an SEM and SEO professional. He uses blogging and content marketing as a launchpad for small businesses looking to grow their online presence.