3 Tools to Help Create an Infographic in an Hour or Less
 ContentPowered.com
Infographics are hilariously amazing for marketing. They’re really nothing more than next-gen web 2.0 spiced up pie charts, but damn do they make people go crazy. A good infographic can get literally millions of hits a day, if all the right circumstances collide and it goes viral on Facebook and Twitter.
The problem is your infographic needs to be great. They’re popular, but because of that, everyone and their mother thinks they can make one and get a million shares. This is simply not true, and it’s why infographic aggregators are swamped with hundreds of terrible, boring graphics every day.
Thankfully, you can use some tools to make a great infographic. You just need to bring a concept, data and talent to the table.
Making a Great Infographic
Making a great graphic doesn’t have to be hard, but it’s going to be a non-trivial amount of work when you’re new to the whole process. If you want to practice or get a feel for it by making a few incredibly basic infographics, you can use Hubspot’s PowerPoint templates.
Step 1: Come up with a general concept. This part should be the easiest part; you’re finding something interesting in your industry that you think your fans and followers would like to know about. Keep in mind that the more generic the concept, the more likely it is to be shared widely. An infographic about wealth disparity or social economics or government spending, for example, is general and of widespread interest. These sorts of graphics end up shared across the nation. By contrast, a graphic about your company’s ad spending, or about the benefits of different valves, or about the growth rates of two types of grasses, those aren’t as general interest. They’ll have a harder time getting people to think to themselves “yeah, I bet my friends would love to see this.”
Step 2: Collect the data you’re going to need. An infographic is just data presented in an interesting way. To present the data in an interesting way, you need the data in the first place. You can harvest data from your own findings, but be aware that you need to have statistically relevant sample sizes, unless you’re capable of measuring precise and accurate information about everything you’re talking about. Alternatively, you can harvest third party sources – citing them, of course – and put that data together in ways others haven’t thought to do before.
Step 3: Brainstorm a narrative arc for your data. All of the best infographics are far more than just a pile of pie charts and bar graphs; they have character and they tell a story. They have a point. You need to figure out how you’re going to present that data, what point you’re trying to make, what story you’re trying to tell. Lay the data out piece by piece, so you show the foundation, then lead to the conclusions.
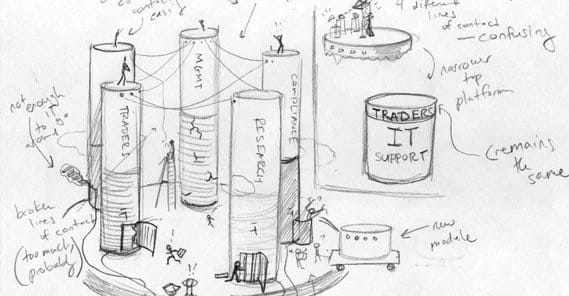
Step 4: Lay out the data and sketch in the flair. The flair, in this case, being whatever makes your infographic more than just charts. It might be creative illustrations, it might just be doodles that supplement the data, it might be interesting ways to present that data beyond just a chart. You don’t have to go full-on interactive animation, but you need to do more than the basics.
Step 5: Finish up and publish the graphic. You might be handing it over to a graphic designer, or you might just be finalizing the PSD and saving it in an Internet-ready format. In any case, once your graphic is done, it’s time to get into the publication and promotion phase.
Tools to Help Infographic Creation
Now, I did say I was going to provide you with some tools to help you create an infographic in a short time, and then I went on to tell you how much work it’s going to be. Unfortunately, my estimate of a couple hours is only the actual creation time itself. You’re not going to be able to brainstorm, collect data, lay it out and publish in a few hours. At least, not unless you either have a lot of ready access to data and a very quick hand with these tools.
 The Definitive Guide to Building Links to an Infographic Infographics are great. They combine all the…

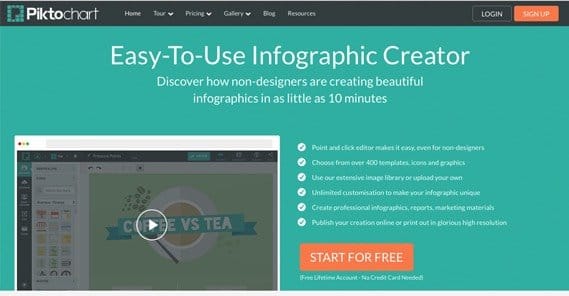
Piktochart is a web-based app that allows you to use a robust editor to create an infographic using their resources. You have a wide variety of basic themes to pick through, or you can customize your own. You aren’t limited to their own graphics – you can upload your own – or in any other way. If all you have is a quick, simple idea, you’re good to roll with this app. Once you’re more experienced with it, you can use their advanced features to get the ball really rolling.
The free account is a little limited, which is unfortunate. You only have access to a few templates and, while you have over 4,000 icons to use, you’re still somewhat limited. The pro account, meanwhile, gives you a ton more templates, an image export feature, and most importantly; white label final products. No Piktochart watermark. It costs $29 per month, or $290 if billed annually.
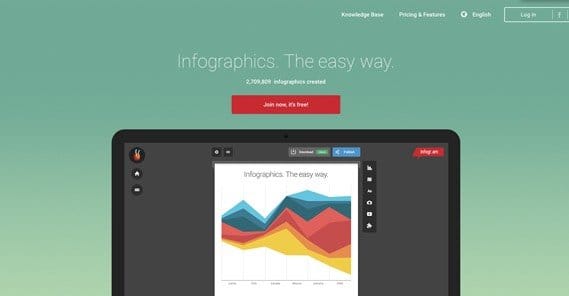
Not to be confused with Instagram, Infogram is an app that takes a template of your choice and your data in a CSV, and converts it into charts and graphics in whatever design you choose. It’s one step above the Hubspot templates, but it’s a little below Piktochart in terms of sheer versatility. On the plus side, it’s completely free; no paid account to worry about.
3. Dipity
When I mentioned those fancy animated and interactive infographics up above, were you instantly enthralled? Did you wish you could create one yourself and run with it, and bemoan the lack of useful ways to do so? Well, that’s where Dipity comes in. It’s a good, simple method for creating timelines and interactive infographics. It won’t be as slick as one made by a professional animator or HTML5 coder, but then, what would be? This is the best free alternative.
Written by Kenny Novak

Kenny is an SEM and SEO professional. He uses blogging and content marketing as a launchpad for small businesses looking to grow their online presence.