How to Use Canva to Create Infographics for Free
 ContentPowered.com
Infographics are great, for traffic and for links, even if they’ve declined a bit in the last few years. There’s just one problem; there’s no easy way to make them. You can work with a talented graphic designer, but you need to take the time to find one. You also need to leave the time open for repeated revisions and adjustments. That’s all not to mention paying them. You can also hire a graphics firm. There are many that specialize in business infographics. The problem with them is the expense; they make their livings with specialized graphic design, and they charge accordingly.
Ideally, you’ll make your infographic yourself, but what if you don’t have Photoshop or the graphic design skills necessary to use it? Well, I have good news for you. Canva is a great web app you can use, for free, to make infographics for your business. How does it work and how can you make a great graphic out of it?
How Canva Works
Canva is essentially a drag-and-drop image editor on the web. It’s free to access, but I might have been a little dishonest if I implied that it was completely free to use. Think of it more like a freemium model, like cell phone games.
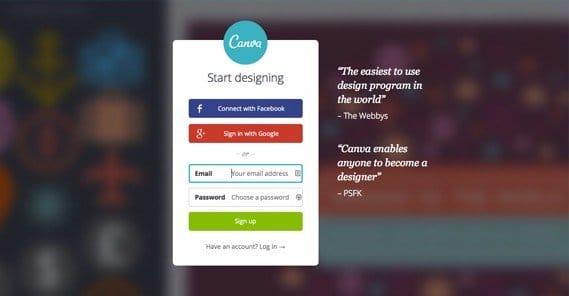
The first thing you need to do to use Canva is to create an account. You can do this via email, or you can connect with a social network, either one works. They aren’t going to spam you with emails, at least, so that’s good.
Once you log in, you choose a template. If you log in through the link I used above, you’ll be taken immediately to an infographic template. You can also use templates for presentations, social media images, posters, Facebook cover photos, and more. They have over 40 templates – basically just image sizes and layouts – and the ability to use a custom size. For this exercise, of course, you’ll be clicking the Infographic option. It’s near the bottom, under “Blogging & eBooks”.
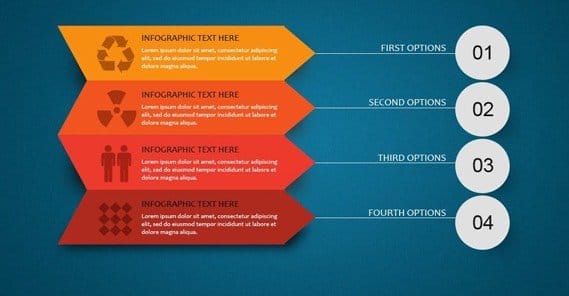
When the editor opens, you’re given a blank infographic, which is really just a tall, narrow image file. From there, you can customize it.
Canva offers a range of different bases to use. They’re essentially infographics that have been created already using the Canva assets library. Obviously, you won’t want to take their base infographics and use them unedited. Rather, you should use them for layout and design inspiration.
So, here’s the way Canva works. You have your blank image file, and you can add assets to it. When you add an asset, you can manipulate it in various ways. You can change size, position, rotation, and transparency. You can also change colors of specific parts of the elements, or the element as a whole, depending on that specific element. For example, there’s a graphic of Saturn – the planet, not the car company – used in a template about the solar system. You can click different colors for the planet itself, the ring, and the stripes on the planet. You don’t have to go at it with a brush or a fill tool, or anything so tedious. All of the fine details are handled by the web app, and you just choose elements and colors.
Here’s where the dreaded “freemium” aspect comes in. Your template is free. Colors are free. Elements, well, not so much. You have a selection of free elements, and a bunch more you can use that have fees attached to them. In total, there are over a million various elements, ranging from clip art graphics to stock photos.
Every paid element, regardless of size or quality, costs $1 to use. This money is split between Canva and the artist that created the element, as a royalty payment for using that image. All elements with fees attached will have watermarks on them while you’re working with them, to prevent you from stealing them. Not that you would. I know you’re trustworthy. They just have to do these things, you know, for other people.
You don’t have to buy the element in order to use it. You have free access to the entire library to create your design. Once you’ve created and finalized your design, then you can click to generate the full infographic. At this point, the elements you’ve used will be totaled up and you will be asked to pay for them. Only then will your graphic be given to you in full resolution for your use.
There is some flexibility. If you create your graphic and notice a mistake, you don’t need to re-create the design. It’s saved for you in their system. As long as you go to make changes within 24 hours of purchase, you don’t have to re-purchase the elements you used. If you add more, you’ll have to pay for them, of course.
You can also create more than one graphic using the same images and only pay for them once. What you’re doing, essentially, is buying a 24-hour license to rent those images for your use. Once that license expires, you’ll have to purchase it again.
There are two ways to reduce costs here. The first is to buy credits. You get a 10% discount on credits, essentially making every element 90 cents instead of $1, assuming you’re paying in advance.
The other option is a subscription service called Canva for Work. You can read more about it at the link, but it essentially gives you access to elements without paying for them, and also gives you some additional features for team collaboration.
Making a Kickass Infographic
Canva is an excellent tool, but there’s a lot more to infographic creation than just using a good tool. You still need to have some sense of design, a solid informational base, and a good grasp of your audience, among other things. To help you along the way, I’ve prepared a process you can use to make a great infographic.
Identify Your Audience
The first thing you need to know is who will be seeing your infographic. Ideally, you’ll have a bunch of buyer or reader personas you use for this exact purpose in other phases of your marketing efforts. If not, read here to learn about creating buyer personas.
Every business and blog has a varied audience, unless you’re a very small, very niche business, and that’s no way to do business. Chances are good, then, that you have a varied set of people browsing your site at any given moment. When you publish an infographic, it’s going to attract different people in different ways. It might appeal more to men than to women. It might appeal more to younger people than older people. The reason you want to know your audience is so that you can tailor your infographic to the audience most likely to be receptive towards it.
 The Definitive Guide to Building Links to an Infographic Infographics are great. They combine all the…

Think of it like a political campaign. A political candidate isn’t creating messages and throwing them out to a random crowd; they’re specifically rallying to certain groups. They might be going for immigrants, or for African Americans, or for blue collar workers, or for billionaires. Their messages are targeted; so too should yours be.
Establish an Ideal Level of Complexity

This will come into play for both your research and for your design. You don’t want to make a graphic that’s overly complex and difficult to understand. There are a few different reasons for this.
- You don’t want to confuse your readers. An infographic works best when it makes complex information easier to understand. If your graphic itself is complex, it defeats the purpose.
- You don’t want to make a mistake. The more complex a graphic is, the easier it is to miss something crucial or make an inept comparison that invalidates your authority.
- With Canva charging by the element, you don’t want to make an infographic concept so dense with information that you’re forced to use a lot of elements, and thus pay more.
Conversely, you want to be wary of a concept that’s too simple. If your entire infographic concept can be boiled down to a couple of pie charts, there’s no reason to bother with a tool like Canva, and there’s no reason to bother with an infographic, since you don’t have anything supporting the graphic part. No matter how interesting the information is, pie charts and bar graphs alone are not the ideal way to present it.
Maintain Focus
An infographic is a visual method of telling a story using facts and research. Think of it more like a comic than a presentation. It might not have superheroes flying in to deliver the 1-2 punch of learning, but it’s not that far away from it. I’ve even seen some infographics with – and about – superheroes.
Thus, the key to a good infographic is having a narrative. You have facts, and you have an audience. Figure out what you want your audience to understand about those facts, and then figure out a way to present that information. Cut out everything that’s not necessary to conveying that information. Don’t worry; it’s not lost research. It’s just information you can use later, in other situations. Figure that any time you’re making an infographic, you’re going to be writing supplemental blog posts to accompany it, and those posts can easily include additional information.
While you’re at it, don’t forget to leave room on your graphic for the graphics. It’s easy to forget that you’re making more than a slightly graphically-tinted white paper or ebook. I know that most of the best graphics are gated behind $1 with Canva, but that’s no reason to skimp on them. Really, what’s the difference between $15 and $20 for an infographic when a graphic designer will be charging you that much an hour, or an infographic specialist firm will charge several times that?
Compile Great Information
The information you use in your infographic needs three main qualities. It needs to be new, it needs to be interesting, and it needs to be true.
- New: The information needs to be something novel, something that isn’t common knowledge. If I’m making an infographic about dogs, you don’t want to know kindergarten-level factoids about them having four legs and a tail, you want to know about breeds or histories or evolution. That’s not to say the information needs to be completely new, just that it needs to be new to the people seeing your graphic.
- Interesting: The information needs to be worth learning or capturing attention. Pretty much no one is going to care about the breakdown of your 4th quarter expenses; they want to now more interesting information.
- True: The information you present needs to be accurate to the best possible degree of your knowledge. If your facts are untrustworthy, so is your graphic, and by extension, so are you. Always go out of your way to fact check and use authoritative sources. If I see you citing some known propaganda site, or a parody site like the Onion, I’m going to ignore your graphic.
If you’re using information you’ve compiled yourself, you should publish that information somewhere in a supplemental post, so you can reap the benefits of referring people to that post as a cited source.
Meanwhile, avoid overly self-indulgent information. An infographic that’s focused more about selling your services than it is about providing interesting information is going to fare poorly. People don’t want what amounts to a huge image advertisement; they want to learn or discover something new.
Maintain Clear Design
Clarity of design is important. With Canva’s easy drag-and-drop infographic creation, it’s easy to go overboard with graphics to embellish your page. Do you really need every element to have a distinct color? Do you need that border, or those embellishments in the corner?
- Limit your use of color. I’m not talking a stark black and white, but it’s easier to use color to emphasize information when you don’t have a bunch of other colors all over the place.
- Keep your graphics simple and easy to interpret. Pie charts, bar graphs and Venn diagrams are all perhaps overly simplistic, but there are more interesting ways to depict the same information in better ways.
- Maintain a logical flow. Fact 1 leads to Fact 2 which leads to Fact 3 and helps users follow your thoughts to Conclusion 1. If the user needs information from Fact 4 to understand Fact 1, maybe Fact 4 should be Fact 1 and everything else should be pushed down.
Additionally, don’t make your infographic too tall. A standard “max” height is around 5,000 pixels. Anything longer than that is going to bore the reader, and it’s an indication that there’s information that you could have cut but didn’t. That’s why Canva is so useful for this; their fixed template size means you have to work within the space you’ve got, and you can’t just expand the bottom until you fit in everything you wanted to fit.
Be Original
In blog writing, one piece of advice I give is “do it better.” Find a top 10 list on a relatively open subject? Write your own top 20 list.
This absolutely does not apply to infographics. Imitation may be the sincerest form of flattery, but it looks thin and weak when you’re doing it with graphics, particularly graphics that require research. If I see an infographic tutorial about how to do something, and I make a tutorial about doing the exact same thing, just formatted a little differently, that’s closer to theft than anything else.
The equivalence with blog writing would be spinning content, here. The thing about infographics is, it’s a lot easier to identify when content has been spun, because graphics are designed to be shared. They’re also harder to make. So the potential audience of people who see it will have likely seen the other version, and will see yours for what it is.
Market and Promote
The final and most important aspect of infographic creation isn’t part of the creation process at all. Rather, it’s the follow-up you have to publication. Once you post the graphic, you need to continue on and promote the graphic. You need to post it on all of your social media accounts, often more than once. Beyond that, you need to engage in blogger outreach. Identify bloggers who might be interested in the subject, or whose readers are interested, and reach out to them. Show them the graphic and make it easy for them to paste it into a post of their own.
Promotion is the difference between an infographic that sits unshared on your site, and a graphic that makes it to the top most viral infographics lists.
Written by James Parsons