Guide to Calculating the Cost Per Click of Your Traffic

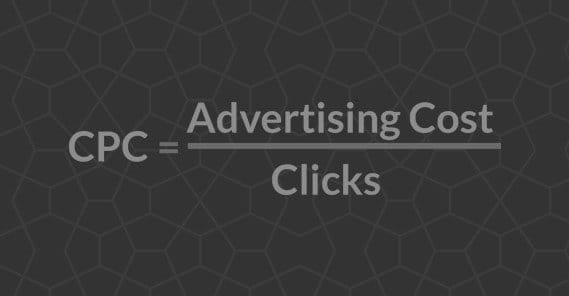
Cost per click, or CPC, is a pretty easy metric to understand. It’s just the amount of money you spend for each click you get. Simple, right?
Where the complexity comes in is when you try to look at all of your different expenses and all of your different traffic sources. Here are some questions you might end up asking yourself:
- How do I calculate the cost per click on organic traffic?
- How do I know if a visitor is returning after seeing a paid ad?
- Should I calculate the value of time I spent on organic marketing?
- What is the cost of X marketing channel?
- What is a good range for CPC?
Some of this comes down to keeping records and assigning values to things. Some of it is a matter of looking in the right places in your analytics. Ideally, you’ll be able to figure out quite a bit.
Checking Ad Networks
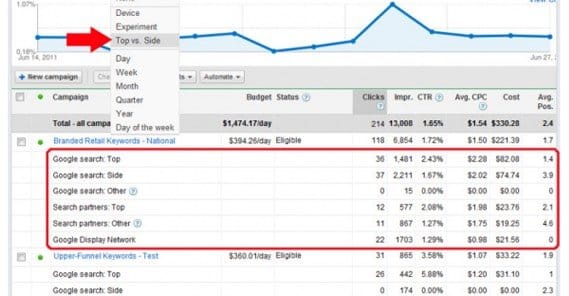
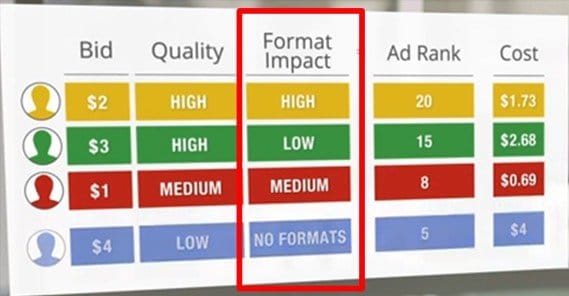
The first and easiest form of CPC you can check out is the CPC provided to you by the ad networks you’re using. For example, Google AdWords has a listed CPC and an actual CPC. The formula is your competitor AdRank divided by your quality score, plus .01. Don’t worry about that, though; you don’t need to know or care about those numbers directly, not for our calculations. All you need to know is that AdWords will record the amount of money in total and the CPC of the ads you run.
Other ad networks will show their own CPCs as well. If you’re using something like Facebook ads, which have better bidding structures, like cost per action or OCPM, you’ll have some calculating to do.
Specifically, you’ll want to take the total amount you paid to run an ad and divide it by the total number of clicks to that ad you received. This will show you the actual cost per click for those ads.
Be aware, though, that CPC is not necessarily a valid metric. You could have a low CPC on a Facebook ad that resulted in no conversions whatsoever. You could have a higher CPC on an ad that, since it was optimized per action, gave you quite a number of conversions but a much lower number of clicks altogether. What it comes down to is the value you’re getting out of knowing the numbers.
Knowing CPC is, for the most part, a comparative number. If you run four ads and they all perform about the same conversion-wise, you’ll want to invest more in the one with the lower CPC. That will get you more views and a higher number of conversions, since the conversion rate is better.
In any case, any ad network you use, you can check your metrics and analytics built into the platform to check your CPC. No ad network these days can operate without an analytics dashboard, so you can be sure the information is available, even if it’s slightly inaccurate due to timing or sampling.
With Google AdWords, you may be curious how your CPC stacks up. Well, there are two factors that go into this comparison. The first is whether or not you’re running your ads in search. Ads in search are generally more expensive than ads in the Google Display Network. You can be running both, of course. It’s up to you. The second factor is industry. Ads in some industries are more expensive than average, due to higher competition and higher budgets. Others are minimal, due to flooding or low value.
For example, ads in the dating and personals industry are extremely cheap, because you need an extreme volume to get any returns. AdWords search ads for that industry average 19 cents per click. By contrast, travel and hospitality ads are closer to $1.55 per click, and ads in the legal industry are almost $6 per click. You can see more in an infographic from WordStream here.
The Matter of Quality Scores
In most ad networks, there is a measurement of quality, often called your quality score for the sake of simplicity. On Google, it’s your quality score. On Facebook, it’s your relevance score. In all cases, it’s measuring roughly the same things.
What does your quality score measure? Typically, it’s a compilation and analysis of various factors that measure how useful your landing page is to the people who click your ads. An ad for red shoes that leads to a product page for red shoes is high in relevance. An ad for red shoes that leads to blue shoes is less relevant. An ad for red shoes that leads to enterprise budgeting software is going to be a lot less relevant, unless of course the software is called Red Shoes.
Quality score also tends to measure how well you’re using the ads program. Google, for example, cares about how well you’ve built out ad groups and how well you’re testing different ad variations.
Facebook rolls in some other factors. Ads that are reported frequently tank in relevance score. Ads that are clicked a higher percentage of the time earn you a higher relevance score. The better your ad performs, the better off you are.
Your quality score, relevance score, or what have you is very important. It typically acts as a modifier to your base CPC. A higher score makes your CPC lower, shows your ads to better traffic, and gives you more opportunities. A lower score raises your costs, because Google needs to make money somehow, and they certainly aren’t making it on ads that don’t get clicked. The same goes for any company; it’s not just a Google conspiracy.
To a certain extent, time is a factor as well. The longer you’ve been using the site with decent performance, the more your quality score will build. You don’t start at the top and lose it as you underperform; you start at the bottom and have to prove you’re worth having a higher score.
Calculating Organic CPC
Typically, we think of organic marketing as “free” marketing. You’re not paying for your clicks, you’re not paying for promotion, you’re just putting content out there and getting traffic in return. I say that’s a bit disingenuous, though; you’re paying, after all.
The calculation is still the same. You take the total costs and you divide it by the total number of clicks you get in that same amount of time. The difference is, the numbers are harder to find.
Let’s start with the number of clicks you get. How do you figure this out? The first thing you need to do is pull your total number of clicks from your analytics. That’s your total for both paid and organic, though, so it’s not suitable for our uses. What you need to do, then, is identify the traffic streams that are paid – ideally they were flagged with UTM parameters or something similar, so you can tell – and remove them from the calculation. When you remove the paid streams, you’re left with just the organic traffic.
That’s on the traffic end; what about the cost end? Here’s where things get complicated.
The first thing you need to do is pick a time frame. You’re only counting traffic in this time frame, and you’re only counting costs in this time frame. If you try to go retroactive with either one, you might as well total up every cent you’ve ever spent and every hit you’ve ever gotten. You’ll have one fancy statistic when you’re done, but it’ll be completely worthless to you.
Next, you need to decide; are you going to count time as a factor? After all, time is money, and the only reason growth hacks are so big, the only reason organic traffic is free, is because you’re putting in time rather than putting in money.
If you want to value your time in the equation, determine how much you want to count. How much do you get paid per hour? How much do you pay employees per hour? How many hours did you and your employees spend on traffic-building tasks?
This is where it can be a little complicated. Something like product fulfillment or support isn’t necessarily a traffic building activity. There are a lot of tasks related to running a business that don’t directly build you traffic. You want to limit your calculations to the actual traffic-building activities, like posting on branded social media, writing blog posts, and promoting your site.
You will also need to calculate the costs of associated tools and other expenses you use that are only for organic marketing. I wouldn’t count the cost of a WordPress theme, for example; that covers your whole site on an ongoing basis, so the cost is negligible. However, a paid subscription to a marketing service, a syndication service, or a social media monitoring service might count. Pro-rate it for the time frame you’re using.
You will want to include the costs of content marketing itself as well. Did you pay for graphic design for your blog posts? Did you pay to have those blog posts ghostwritten or edited? Did you pay for guest blogging spots? Did you pay for any third party “enhanced” social functions or engagement? These are expenses that turn organic traffic into not quite organic traffic.
Finally, once you have both your calculated traffic and your calculated costs, you can divide the costs by the traffic and see how much your “free” organic traffic is actually costing you.
Beyond CPC
There are related metrics you might want to look into beyond just the cost per click for your traffic. For example, if you have two ads with identical cpc, which one is better? Well, the one with the higher number of conversions might be, but if you have two identical CPC ads and they both had 10 conversions, one might still be better than the other if the one had higher average cart values.
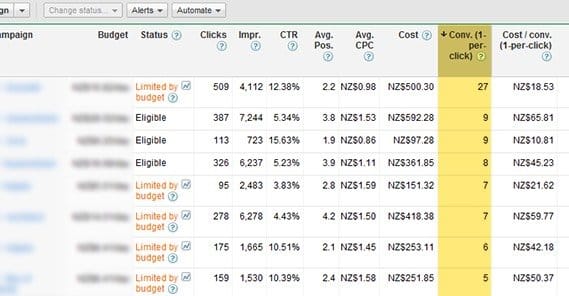
Cost per conversion is one metric you can use to monitor yourself a little more closely. Rather than just calculating the amount of traffic you get and comparing it to the amount of money spent, you’ll want to calculate the amount of conversions you get and use the comparison there. This is what Facebook is doing with cost per objective or cost per action ads, but it can be done with all of your traffic streams, even organic.
It’s all tricky, though, because there’s a lot of intangible value floating around. It isn’t as though your old content ceases being valuable a month or two after you created it; quite the opposite, in fact. If your content is old, it’s a paper trail and a history. People know that your site has been around, producing value, for quite some time. This adds to Google’s inherent trust in you, and boosts you in the organic search rankings. That’s why older sites rank so much better so much more easily than newer sites.
There’s also brand reputation. If you’re new, or if you’re small, sometimes a good source of value is nothing more than getting your brand name out there. You can sort of monitor this by monitoring social media mentions and Google alerts for your brand name, but that’s only representative of the people who hear about you and then blog about you.
These other sources of value are much harder to monitor, both in terms of what they bring to the table, and in what they cost to achieve. If you can figure out a way to monitor your reputation and your brand awareness, feel free to compare those to your investments as well.
At the end of the day, there’s more to your marketing than just the raw cost of your traffic. You can take a bunch of different perspectives, look at your data from different ways, and find value where you weren’t sure you had any in the first place.
 ContentPowered.com
