The Definitive Guide to Building Links to an Infographic

Infographics are great. They combine all the good points of data, case studies, blog posts and images, while discarding the low points. They’re some of the most easily shared content on the web. Users don’t need any special setup to view them or get value out of them.
As a marketer, infographics are great for one reason; they bring in a ton of links. You hardly have to put any effort into it at all to get great returns. Even a mediocre infographic will get a bunch of shares; a great one can go viral with ease.
Before you can build links to an infographic, though, you need a good infographic. If you’re just throwing a few pie charts or bar graphs on a grid and calling it a day, you’re just reinventing the boring office presentation.
Step 1: Concept
Before you begin, you need to come up with the topic for your infographic. Typically, you’ll be starting from one of two positions. Either you know what you want to cover, or you just want something you can share. If you know what you want to cover, this step is done for you. If you’re looking for something to boost traffic, you need to do some brainstorming.
Try to consider any possible topic from a number of perspectives. What will your target audience want to know? Is the subject something that your brand can be considered a reputable source when covering? Has the topic been covered before, and if so, can you do it in a better, more innovative way? Is the topic too big or too narrow for a good graphic?
Step 2: Gathering Data
Once you have an idea, you need to gather the data. For a graphic covering your own internal data, this is easy. For a graphic covering a wider industry trend or global data, you need to gather your information from reputable sources. Research firms like Forrester, Gartner, Market Research and Nielsen are all good. You can also use worldwide data sources, like the World Data Bank, the UN Data site or UNESCO.
Step 3: Making the Graphic
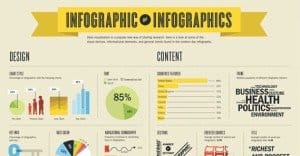
Putting the actual graphic together is a complex undertaking best left to your graphic designers, if you have some. I recommend browsing around and looking at some of the most popular graphics out there. You can find a good list here on Moz.
Good graphic design combines words, images and the logical presentation of sequential information to tell a story. Your goal is not just to present the data. You can do that with tables in a blog post, if that’s all you want. Your goal with an infographic is to present the data in a way that makes it easy to digest. Trick your viewers into thinking they’re reading a comic, only you’re teaching them something along the way.
Step 4: Promotion
This is what you’re all here for. Now that you have a compelling infographic, how do you share it? How do you promote it? There are a number of methods you can use.
First and foremost, post it on your blog. You want your blog to be the primary source, to which all other sources link back. Cut a compelling segment of the infographic and use it as a preview image, specifically set up for locations such as Twitter website cards and Facebook previews.
Make sure you post a blog article to accompany the infographic, giving it added value. Likewise, make sure your infographic itself includes a link back to your site, either through your own URL or, if it’s too long, a shortened bit.ly URL.
Once the graphic is live on your site, publish it on infographic compendiums. These can include sites like Visually, Cool Infographics, Daily Infographic, Chart Porn, and even Reddit’s /r/infographics. You can probably make a list of a dozen such sites, but make sure they are reputable and they have a reasonable amount of traffic before you share your graphic. You don’t want to accidentally hurt yourself by posting on a thin directory site.
Next, start a campaign of posting your graphic on your social media pages. Pinterest and Instagram both benefit from visual media, and thus will work well with infographics. Facebook, Twitter and possibly Google+ if you use it are also good sources. LinkedIn is good for certain types of infographics. Spread it around, and post it more than once, to capture users you didn’t the first time around.
Once you’ve shared it on social media, you can start looking at industry blogs. Find interesting blogs that much want to know about your graphic and start sharing it. There are a few categories of blogs you can investigate:
- Blogs in your industry who would be interested in the data and would share it to their audience, so they can see the data as well.
- Blogs about data, who like to see nicely-presented information.
- Blogs about web design or infographic design, who might want to see your graphic and study it for their own ends.
Don’t forget to make it as easy as possible to share your graphic. On your site, when you publish the graphic, make sure you have social sharing buttons. Likewise, give a box with embed code that adds the graphic, a link to your site and a short description. The easier it is to share your graphic, the more it will be shared.
If, after all of this, you still need a boost, you can consider using paid advertising to send people to your graphic. You can also use guest blogging, though you need to make sure the post you write that includes the graphic is unique compared to other posts including it.
Finally, once the life cycle of the graphic is dying down, you can breathe new life into it by making it into slideshare presentations and videos. These can earn you even more shares, and bring a second wave of traffic to your graphic.
 ContentPowered.com


