Are There Any Good Free Website Heatmap Tools?
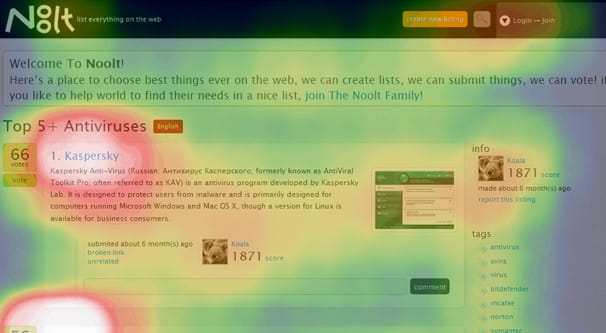
Heatmaps are excellent tools for optimizing your website in ways you might not otherwise think to do. If you’re not sure how they work or how they can help, read on; if you already know, skip ahead to our heatmap recommendations.
How Heatmaps Work
Heatmaps in various forms are used globally. Some literally use heat tracking to monitor activities of people or even organs within a person, medically. More often, a heatmap is used to monitor activity. The more dense the activity in an area, the “hotter” the area is. Foot traffic across a college campus can be monitored, vehicle traffic throughout a city can be monitored, and so on.
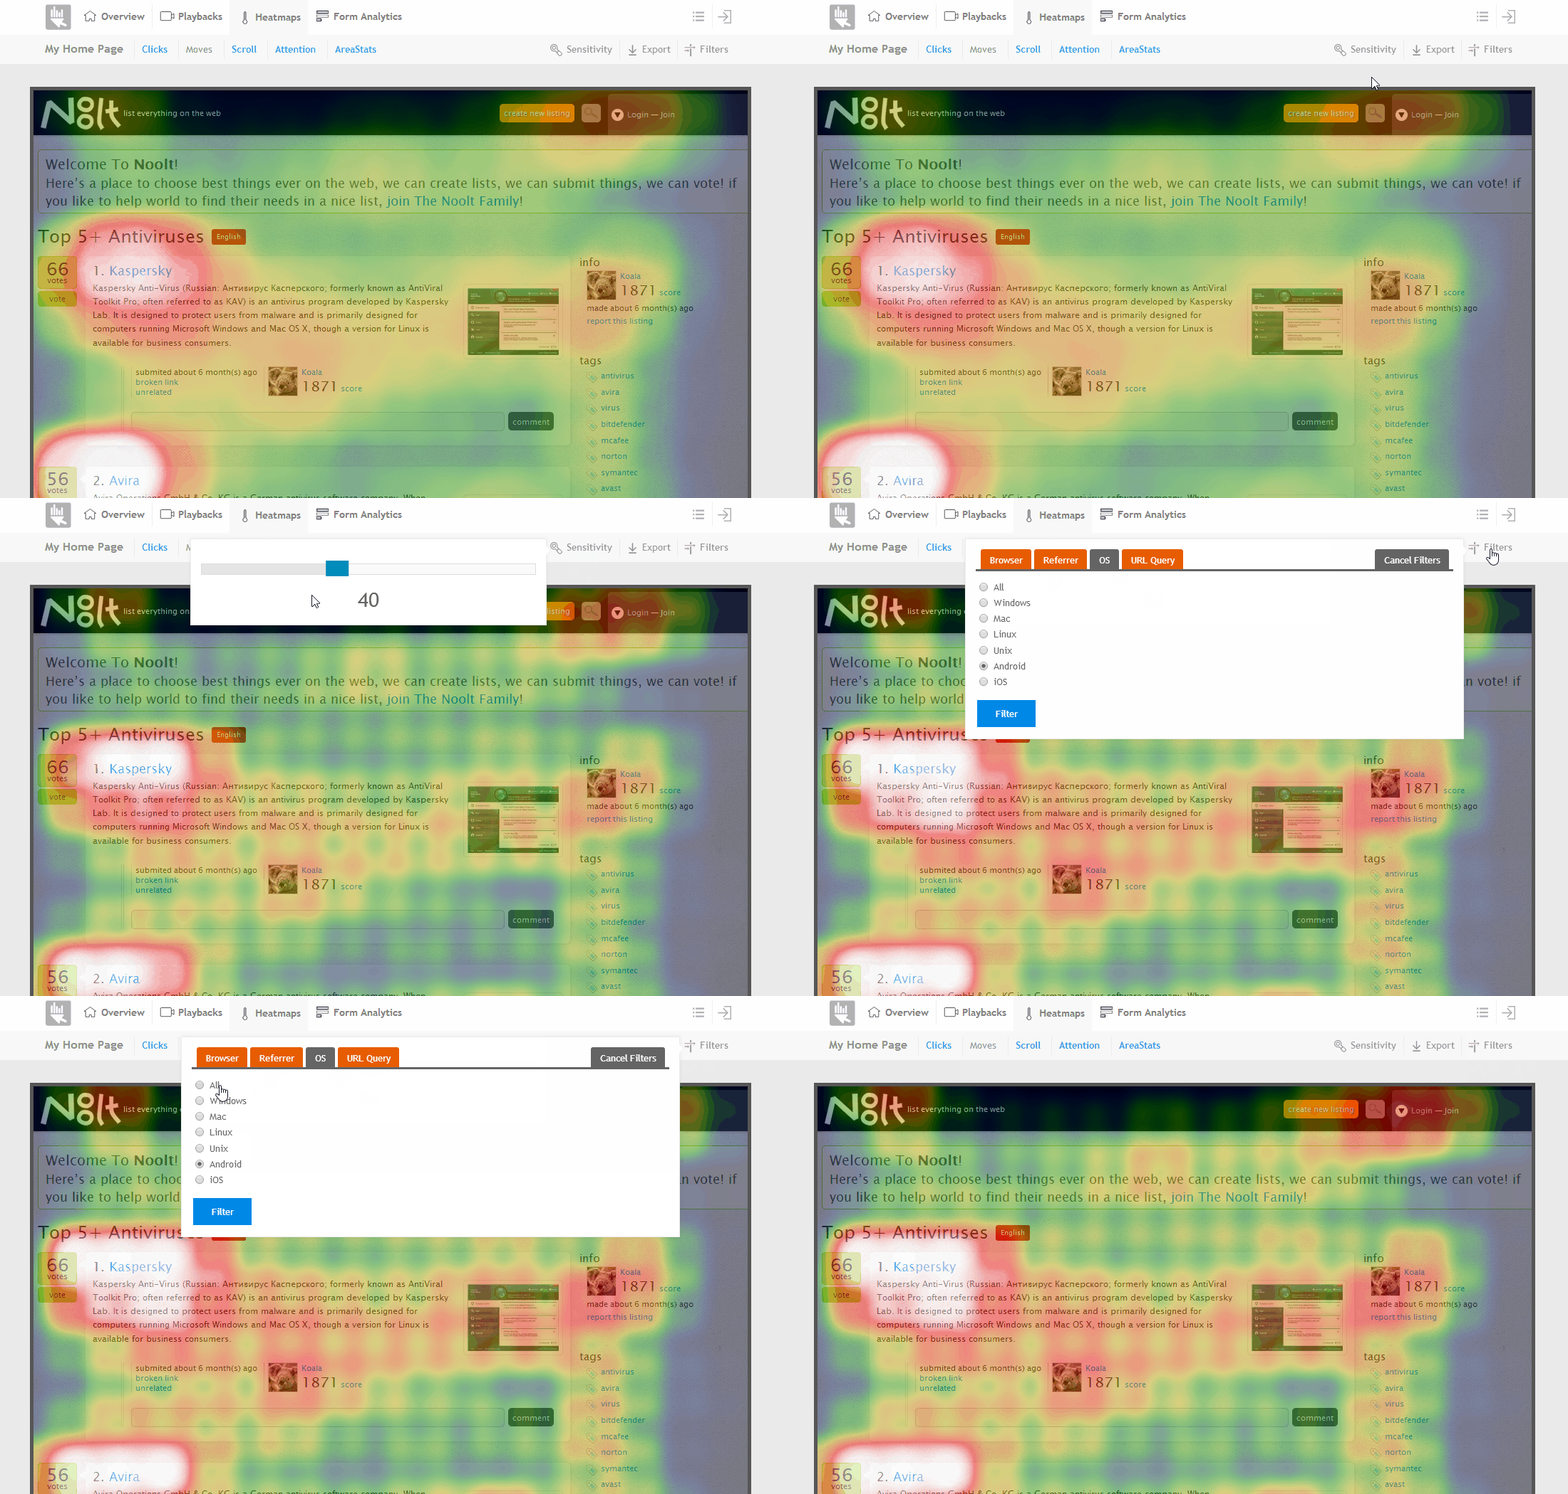
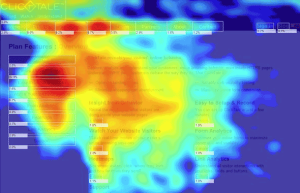
On a website, a heatmap monitors cursor and/or screen activity. Most simple heatmaps monitor clicks. Each click on the site is one data point. The more clicks there are on a specific area, the “hotter” that area is. Many heatmaps, then, will look much like the examples on this page.
English language readers start at the top and read down, and start at the left and read right. Thus a heatmap for Google’s search results will have the largest density of activity – the heat – in the upper left of the page, with the most clicks on the first result. As you progress to further results, the ads to the right, and other page elements, heat density drops.
There are some drawbacks to heatmaps, primarily based in the assumptions one makes about data. You can read more about those on the example page I linked above, as well. We’re not super concerned with the drawbacks of heatmaps in general, though. If you’re going to use a heatmap, you’re going to need to understand how they work well enough to actually interpret the data, and doing that will depend on the software you choose to use.
On a technical level, a heatmap is generally a script that runs on a page, tracking aggregate data about clicks on the page. Some are more sophisticated than others, but they all generally just monitor user session information, to help you get an idea of how users are using your page.
Using Heatmaps to Improve a Site
Google doesn’t necessarily use heatmap data, but imagine a scenario where Google looked at the heatmap of a search results page and found that a huge proportion of users were clicking on the second result in preference over the first result. Since the general human behavior is to click the first result, and Google tries to serve results in an order with the most useful pages first, you would think that the first result would be the best. If the majority of users are clicking the second instead of the first, it indicates an issue with the first. Google could then investigate and find out if the first result is a broken link, is somehow hidden or inaccessible, includes text that makes users not want to click, or otherwise is broken in some way.
This is the kind of implementation you can use on your own website. A heatmap will allow you to see where users are clicking. You can find usability issues and lost opportunities with heatmap data.
For example, imagine if you have a top bar navigation that has four options, and then a graphic that advertises another service on your site. If that graphic is not a link, you might discover that a lot of users are clicking on that image hoping it will be a link, only to discover that it’s not. You can capture all of that user intent by making that image a link, and more fluidly capture user behavior.
Conversely, if you have three links in a piece of text, and you find that virtually no one clicks the third one, you might investigate why. Maybe it’s too small of a link, maybe it’s not an interesting call to action, who knows. The point is, you know users aren’t clicking it, so you can look into what the problem might be.
In any case, this post isn’t meant to dive into ways you can use heatmaps, I’m just giving you a few examples. Many of you came here because you already know the value of heatmaps, and you want to know if there are any good free options. So, let’s discuss the options available to you.
Free Versus Paid
Heatmap software is often sophisticated and complex, by necessity. Think of how many dynamic elements are on a page. Heck, check out this page and then mouse out of it. You see that pop-over? My heatmap would show a large spike of activity where the X on that box is, as people click to close it. If the heatmap software snapshots the page without that pop-over, I might wonder why a ton of people are clicking on whatever is under that X at the standard resolution. I might misinterpret that data. A good heatmap app will be smart enough to show a session replay rather than just static data, and can show when data is associated with specific dynamic elements.
Free heatmap apps are generally going to be less sophisticated. You know how it goes; any app, the more features it has, is going to be more valuable and thus can charge more. There are exceptions, for apps that have alternative means of payment, but those aren’t necessarily the norm.
Should you use a free app or a paid app for your heatmap? That’s up to you and the data you think you can get out of it. If your site is generally static rather than dynamic, and if you don’t need advanced session replay features or dynamic tracking or heatmap split testing, you can probably get away with a free heatmap. If you have a complex setting and need specialized monitoring, you might only find it with paid apps.
The Gold Standard
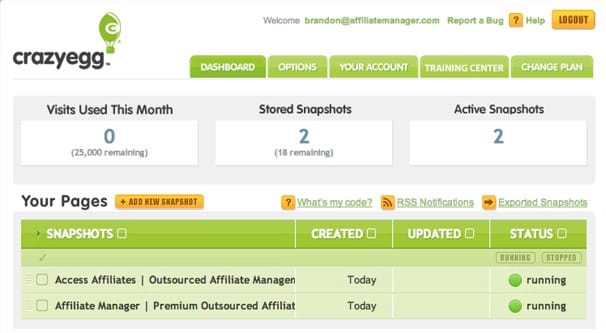
Before getting into free options, I have to mention that the gold standard is Crazy Egg. Crazy Egg is probably the single best website-based heatmap in the industry. They have all the features you could want; session tracking, snapshots, recordings, split testing, compensation for dynamic elements, and more.
Of course, they’re priced accordingly. Their basic plan, with a limitation of 20,000 monthly pageviews, 100 snapshots, 100 recordings, and limited data storage, is $30 per month. For larger volumes, you need higher tiers of plans. They have a 30-day free trial, though.
If you’re interested in using a heatmap, I recommend starting with Crazy Egg. Implement their system on the free trial and gather data to figure out whether or not you can learn anything new or make new observations with the heatmap data. If you find that there’s nothing really novel that you didn’t already know through analytics, or if you find that you don’t have sufficient traffic to make a heatmap worthwhile, you can drop it. If you find that you can make decent use of heatmap data, you can drop Crazy Egg and find a different free heatmap. And, of course, if you really like what Crazy Egg does, you can move on to paying for a plan.
Free Heatmap Apps
Since you’re here looking for free options for heatmaps, I have to tell you, they aren’t going to be top of the line. They’ll be functional and fine, but any free app is going to have some kind of drawback. I’ve done my best to point those drawbacks out as I recommend these below.
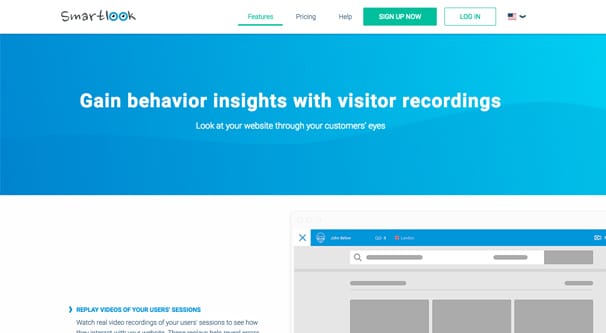
Smartlook is the first option. They have a variety of types of data monitoring, including specific user session recording, aggregate heatmap data, event tracking, and sales funnel tracking. They have paid plans, but they also have a free plan which is limited but large. Specifically, they will track up to 100,000 visits per month, which is fairly high for a free plan.
Of course, as I said, there are always drawbacks. Smartlook’s drawbacks are in the breadth of saved data. They only allow limited recordings, only three heatmaps, limited analytics, and only three days of data history with their free plan. If you check the data regularly and save it externally, such as with screenshots for your heatmaps, it can work fine. However, it’s not a ton of historical data to compare, and even their paid plans don’t offer much in the way of extended data history. They also have no split testing features or other forms of tracking.
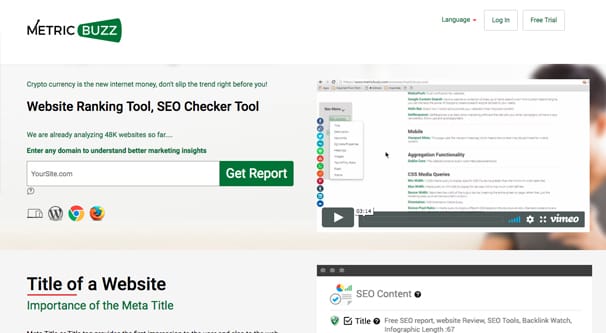
MetricBuzz is a second alternative. It has website tracking, but it relies on scripts hosted on third party sites, which can be a gigantic issue for some sites.
Running scripts from third party domains can be a security issue and can have conflicts with some SSL certificates, as well as running afoul of script blockers. You also run the risk of the third party script doing things you’re not sure of, and you have to read through the script to make sure you trust it.
That said, it’s a truly free tool, at least as far as I can tell. Frankly, I’m not sure I’d personally use it, but I don’t see anything overtly scummy about it. Give it a shot and feel free to report back; if it’s nasty, I’ll remove it from the list for sure.
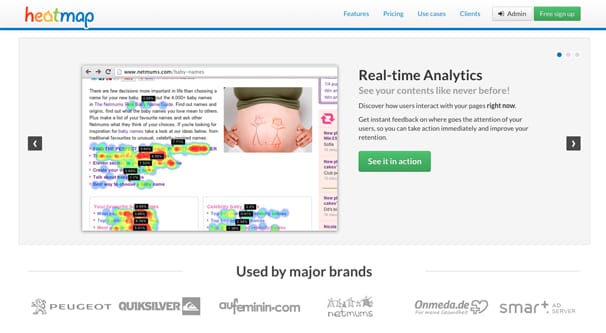
Heatmap.me is a limited free heatmap option you can explore. The free plan has no time limit, though of course it will endeavor to get you to convert to a paid plan if it can.
You get your on-site click heatmap, with adaptations for responsive design and even real time data. You do NOT get conversion tracking, technical support, or template analysis from the company. You’re also limited to one site, and you can only track up to five pages on your site at a time. Data retention is up to six months, which isn’t bad, as far as these things are concerned. They also cap at a million monthly pageviews, which is huge for a free package.
Worth noting is that Heatmap.me has their own WordPress plugin, if you’re using WordPress as your CMS. You can see the plugin here and decide if it looks good for your uses.
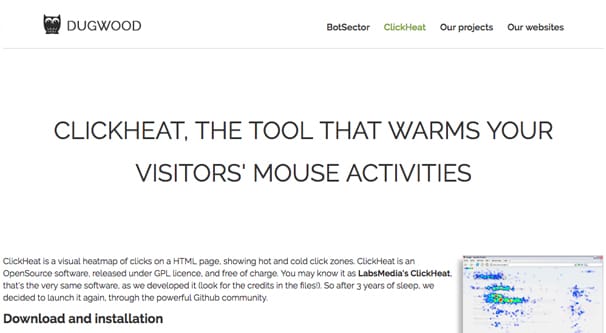
ClickHeat is a very simple click density heat map. It’s 100% free and 100% unlimited, but also very simple. The reason for this is that it’s an open source tool; you can read the script and even adapt it if you need to. They have the code available on GitHub, where you can clone it, download it, or otherwise make use of the code.
The downside of course is that it’s a fairly simple script. If you have a dynamic page with a lot of moving elements and static elements, your click data won’t necessarily be accurate. It also has no individual session tracking, session playback, or other advanced features. For simple pages that want click data, it’s great. For others, it’s too simple to be of value.
HotJar is another of the great heatmap apps, on par with Crazy Egg. They have a free version, but it’s extremely limited. You can only make limited reports, and while you have a year of data storage and unlimited users, you can only collect data from 2,000 pageviews per day. To put that in comparison, that’s 60,000 or so per month, smaller than most other apps out there.
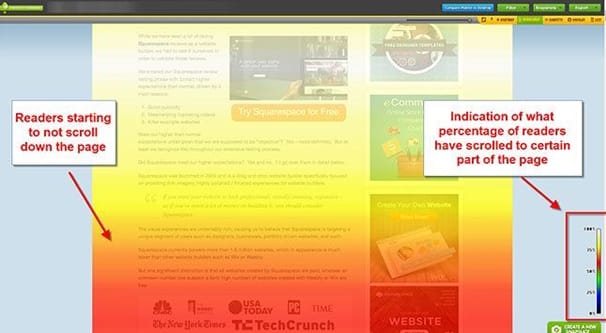
On the other hand, the free plan is not restricted in what data it will access. You get your click heatmaps, your motion heatmaps, your scroll maps, and can even download and share maps. Visitor recordings are fine too, though again, you don’t get too many reports at a time. Still, it’s worth looking into.
Do you know of another FREE heatmap option? I know a lot of other options have free trials, but I’m not really interested in recommending free trials over free apps here. If you know a free app, let me know in the comments and I’ll check it out.
 ContentPowered.com




Thank you for your article. It has helped.