How to View Sales for an Individual Product on Amazon
 ContentPowered.com
When you’re selling a lot of different items on Amazon, you often want to be able to access data about different products and product sets on an individual basis. Amazon provides a lot of this data, but they’re not exactly forthcoming with it. You have to know what you’re doing and know where to look to find it. Let’s talk about the various dashboards you might find useful.
Viewing Product Sales Data Individually
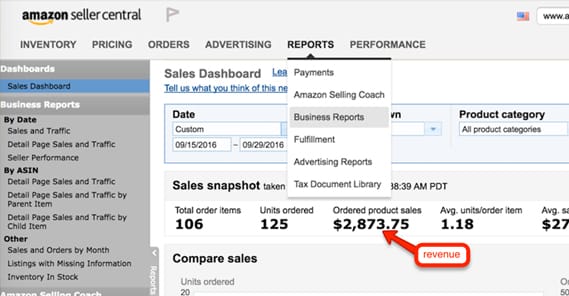
If you’re selling more than one product, and you want to see the sales data for each product individually in aggregate, you can do so using the Detail Page for Sales and Traffic. You’ll find that page under the Business Report in the Seller Central dashboard.
The trick here is that this information isn’t available to any old seller. Individual sellers, unfortunately, get the shaft here. In case you weren’t aware, there are two seller plans on Amazon.
The individual seller plan is for people who plan to sell fewer than 40 items per month. This is individual items sold, not types of products, so you can’t make an “individual” storefront with 39 items in it and get away with it. Individual plans don’t have a subscription fee, but are charged a dollar per item plus some variable fees.
The professional seller plan is the one that gets all of the additional seller dashboards and analytics, which Amazon finds aren’t useful enough to provide for individual sellers; after all, most individual sellers are just selling off a few items every year or so, and don’t care about business-scale analytics. If you want to actually see your performance, though, you need the professional seller account. This account is for people planning to sell more than 40 items per month, and has a monthly subscription fee of $40, along with the variable fees.
“But that’s the same as the individual plan!” you might say, and you’re right in a way. Think of it as Amazon having a $1 per item sold fee up to 40 items, regardless of plan. Professional sellers also get special treatment. What benefits do they have?
- The ability to sell to all of North America, rather than just one country out of the USA/Canada/Mexico triad.
- Access to bulk listing tools.
- Access to analytics via Amazon’s marketplace web service.
- The ability to customize your shipping rates.
- The ability to offer special promotions and additional options, like gift wrapping.
- The ability to be listed in top placement on product detail pages.
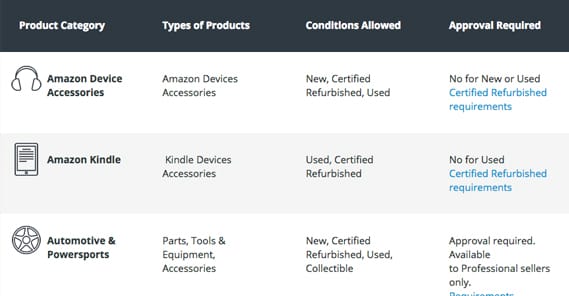
- Access to specific categories of products.
That last one might be important; certain categories of products are restricted to help Amazon monitor quality. Automotive items, B2B products, clothing, and a bunch of other categories are restricted. You can read the full list and all of the variations here.
Anyways, unfortunately, if you don’t have access to the professional sellers analytics, you won’t be able to get per-product data unless you comb your receipts and put it together manually.
Viewing Product Sales By Day
Amazon does not provide a way to see individual product performance over time. If you choose to view sales data day by day, you will see the data for everything in your store on a per-day basis. If you want to see data on a per-product level, you will see the total sales of those products over time, but you will not be able to see a breakdown of that data on a day to day basis. How can you reconcile the two data sets?
Microsoft Excel has a feature that can help you here, called a pivot table. Pivot tables are one of the more unique features of Excel that set it apart from other spreadsheet programs and apps. It essentially programmatically draws the relationships between data sets to allow you to view them as you want to view them, without needing to create individual charts for every possible variation.
In this case, here are the steps you should take to view product data by day, as presented by NetFocusMedia. I’m not an excel wizard, so talk to them if something doesn’t work quite right:
- Go to your sales data under Reports, Fulfillment, All Orders. This will present you with your sales data in a chart format.
- Export your sales data into a CSV file, then import that file into Excel.
- Create a new column at the end of the data and label is “order date clean”. Add a formula to the column: =LEFT(D2, LEN(D2)-15).
- Copy that cell down throughout the column. You can do this by dragging the small black square in the corner of the cell down, and it will repeat the formula, adapting it as necessary to the cell specifications.
- Highlight the whole sheet by clicking the black cell in the upper left. Up at the top in the menu bar, click Data, Pivot Table, and then choose “create automatic pivot table.”
- Select the table that appears and choose to filter the data however you like. You can view your data in a lot of different ways, but the primary use case for us here is to view it based on your order date data. That’s the “order date clean” column you created above.
This will show you your static data for the moment when you exported it. If you want to update your data, you will need to re-export and re-import the sales data in steps one and two again. Unfortunately, there’s no easy way to pull the data dynamically; you would need access to Amazon’s API for your sales data, and you would need to make an app that makes the appropriate API calls, puts the data in a table and creates the charts for you. If you’re at a point where you can make such an app, you can do a lot more than just use a pivot table.
Recommended Tools
A lot of the data you might want to see actually isn’t available from Amazon. After all, Amazon is such a large megacorporation they don’t really need to provide that data themselves. What are you going to do, start your own version of Amazon? They’re the only game in town, and their monopoly allows them to do some thing a little half-assed, to put it bluntly.
Let’s start off with the FBA revenue calculator. This is actually an Amazon tool, but it’s not easy to find. It’s a way you can calculate the prospective profits of an item you might want to sell on Amazon as fulfilled by Amazon. It’s a bit of a sales tool for Amazon to convince people to use FBA rather than handling fulfillment themselves, but setting that aside, it’s still useful information.
 The Ultimate Guide to Getting More Sales on an Amazon Store Amazon has a very robust affiliate program,…

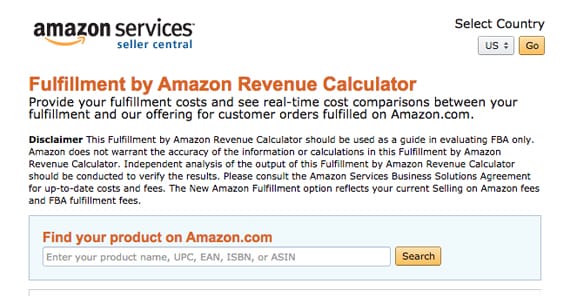
To use the tool, you need to have an idea of how much it will cost you to handle fulfillment of your product. This includes your item price, shipping costs, and handling costs such as the cost of storage, the labor to pack and move it, the cost of packaging materials, and so forth. Once you fill in as many forms as possible, you can hit calculate and Amazon will figure out how much profit you will make per sale based on their fees and costs versus yours. It’s a good way to determine whether or not it’s cheaper to handle your own fulfillment or offload all the work to Amazon.
Second on the list is Payability. Payability is an interesting third party app that lets you have much more fluid access to your business profits. You essentially pay a premium to have access to your money faster.
See, with Amazon sales normally, you get paid on a two-week basis. You make a bunch of sales, but you don’t get your money right away. If there’s a run on your product and you sell out, you have to wait for your paycheck to come in so you can buy more inventory, by which time you may have missed the window to keep selling. Sure, some people will order a backordered product, but not everyone will.
Payability basically just hooks into your account and redirects your profits to their accounts. Then, when you make a sale, they pay out that sale directly to you immediately. You have your money on hand immediately and can reinvest on a much more rapid schedule than you otherwise could.
Payability does require you to have at least a 90 day sales history and at least $2,000 in monthly sales, and their pricing is a flat 2% off the top of your sales. You sell $100 in items on Tuesday, and they’ll give you $98 on Wednesday; it’s that simple.
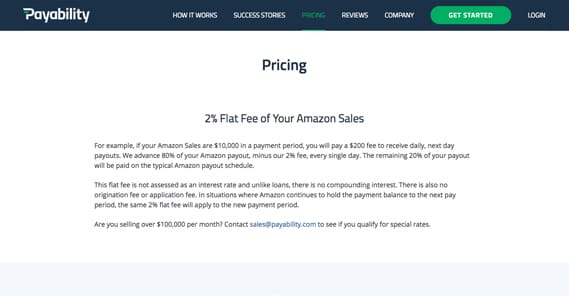
Payability is not for everyone, of course. If you have enough capital banked that you don’t have to wait and stress over Amazon’s timing, you don’t need a cash advance service like this. If you’re too small to meet their minimum standards, you can’t use them, and so on. If you’re in just the right situation where having faster access to your profits will allow you to grow your brand faster, though, it can be a good idea.
To further maximize your potential profits, you might consider using an automated repricing tool like BQool’s repricing central. What does a repricing tool do?
Essentially, prices for products on Amazon are shifting all the time. A product might cost $20 today, and then someone else wants to get the sales, so they price theirs at $19.96. You’ll lose sale to that person unless you notice and drop your price to a bit lower, like $19.94. Repricing goes on, back and forth, until one side can no longer sacrifice their profits and bails out on the product bid war.
If you have a storefront with dozens of products, you want to maximize your sales, but it can take hours of your day to check over every product and reprice anything that needs to be nudged downward. BQool does it automatically, based on factors you set, including profit margins and profit strategies, pricing targets, and simply “be in the buy box” targeting.
One main reason I like BQool, though, is their data harvesting. They don’t just automate all of this, they show you the data backing WHY they make the changes they do. They show you the products, the categories, the competition, the fulfillment, and your ranking in the product listing. You can also see your repricing history and a pretty comprehensive reporting dashboard for visualizing store performance. It’s a price-focused analytics dashboard that can be very useful.
Finally, I’d like to praise the virtues of ManageByStats. ManageByStats is a dashboard of analytics information that pulls your seller data from Amazon and makes it useful to you. All of those tricky pivot tables and data management options are out the window; you get it all here.
The idea is that you should be managing your seller presence and your business based on data, not on assumptions and Amazon recommended pricing. Don’t trust other people, trust the data. You’re not the only Amazon seller frustrated with how hard it is to access all of this data, after all. Amazon sellers, fed up with the lack of data, made this app.
What kinds of data can you see? You can get charts and graphs with your daily, weekly, monthly, and annual data based on seller account, on individual brand, on product line, on product type, or even on SKU. You can even see product sales information based on customer name, contact information, or order ID. All of this is accessible for just $50 per month. It may not be free like Google Analytics, but it’s one of the best ways you have to access all of this data with a minimum amount of manual work on your part.