Which Countries Have The Highest CPM Payout Rates?

When you’re running a website, you want to monetize it. When you want to monetize your website, you want to use a kind of advertising that will get you as much money as possible.
Now, CPM ads are about the bottom end of this spectrum. These are display ads; advertising that pays you when real users see the ads, and don’t care whether or not they’re clicked. CPM display ads pay less than other kinds of ads, like CPA, CPC, or Affiliate advertising. On the other hand, you have to do the least amount of work to monetize your audience. You don’t have to convince people to click, you just have to get eyes on page.
Also, it’s worth noting that what we’re talking about today isn’t strictly CPM. CPM, or Cost Per Mille, usually refers to the amount an advertiser pays to show their ads. The CPM of an ad network, then, is the amount of money you pay to show your ads to a thousand people.
When you’re talking about running display ads and earning money – or specifically about the payout rates of an ad network – you’re talking about the RPM of the ads. This is the Revenue Per Mille, or the amount of money you make per thousand views.
RPM and CPM are not the same. The ad network you’re using will always be taking a cut of the profits, unless they’re charging the advertiser for additional services. You often read an ad network talking about paying 80% rates, or what have you; this is the amount you get from what the advertiser pays. If an advertiser pays the ad network $100 for 1,000 views, their CPM is $100. If the ad network then pays you $80 for 1,000 views, your RPM is $80. The ad network has taken a 20% cut of the transaction.
This is, incidentally, why many sites opt to sell their ad space manually or on an open market like BuySellAds. If you do the legwork yourself, you can earn more because the ad network isn’t taking a cut. On the other hand, that means investing the time and effort of managing your advertisers yourself, which also means implementing fraud protection and other systems to maximize the quality of your traffic. There are tradeoffs with every transaction.
Mitigating Factors
There are, to put it simply, a ton of different factors that go into the calculation to determine your CPM.
Here are just some of them:
- Ad Network. Every ad network will have different CPM rates, even for the same site. This is because they calculate everything based on all of the other factors, up to and including the size and demographics of their advertisers. The same site will get different RPM on different ad networks, even without changing a thing.
- Country of Traffic. The main focus of this article, the country your traffic comes from tends to have a huge impact. Some countries pay better than others, though of course that in turn depends on how well suited the traffic you refer is to that country. If you’re a website in Spanish talking about Spain tourism, you’re going to get the best ad rates from a Spanish-focused advertising network, rather than something like AdSense or AdMob.
- Language of Traffic. Similar to the country of traffic, the language of the traffic matters. Globalization aside, generally English-language content will pay the best, though it also often pays the worst. As usual, suiting your language and location to the content is ideal. In some areas, secondary languages are useful and can be valuable, such as Spanish content in states bordering Mexico, or French content in ads that target Quebec.
- Display Location. Ads showing above your content in a top bar are going to make more money than ads showing in the footer. Ads in the sidebar are generally, but not always, going to make more than ads showing sporadically within content. Ads showing in targeted lists, like an email newsletter, are likely going to make more. The display location matters.
- Device Type. PC ads and mobile ads have different rates, and this will in turn affect rates from other elements on this list. If your content is more focused on mobile topics like apps, you’ll earn more from ads reaching mobile users than from desktop users, for example.
- Site Statistics. All kinds of demographics and statistics go into calculating the RPM of your potential ads. If you have a lot of traffic, or are highly positioned in your industry, you can likely command higher rates than much smaller sites and generalist blogs. If you have a narrow demographic, your users are more valuable to certain advertisers, and you can get higher rates from those – but lower rates from less relevant advertisers.
- Traffic Volume. Worth noting separately, the more traffic you have, the more doors are open to you. Many of the best, highest paying display advertising networks will only work with sites that have 500,000 or more monthly average views. Some start at a million. These tend to command a premium, because they’re large and valuable to advertisers. Smaller sites have to make do with smaller payouts.
- Content Industry. Different general industries tend to have different average rates. For example, according to MonetizePros, industries like Entertainment will range from 30 cents to $4.50 for RPM, while something like Parenting might range from $1 to $5. Finance tends to have high rates, due to the average value of a conversion. Something like sports, gaming, or food will have lower rates, again due to the average value of the conversion.
- Spam Percentage. The more bots and the more fake views your site sends, the lower your rates are going to be. This is some relatively minor variance, though, for one reason: you get cut off at a certain point. If you refer too much spam, many ad networks would rather ban you from their network entirely than have to deal with the potential reverted payments or unhappy advertisers. Suffice to say, the more spam you have, the lower your rates will be.
So as you can see, there are far too many factors to reliably say anything about any rate. You can isolate one factor and show some metrics for it, but those metrics can have a very wide range based on the other factors.
Looking Into Data
There are a ton of different sources of data for average CPM or RPM rates, throughout the last few years and across different ad networks. The fact is, it’s pretty hard to get any consistent source of reliable data. Everyone has to work off of the data set available to them, and the sources – like AdSense directly – aren’t entirely likely to publish complete access to data sets.
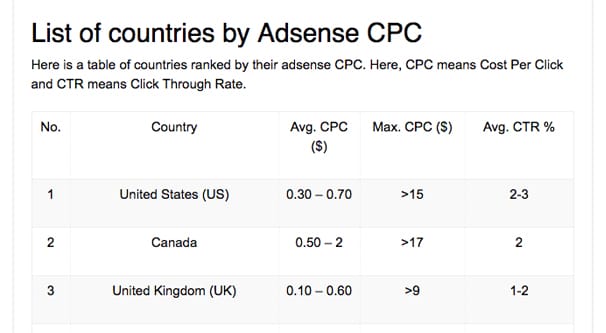
WebRash in 2016 published this list of average CPC rates for various countries. The top ten countries they found were the United States, Canada, the United Kingdom, Germany, Thailand, Japan, the United Arab Emirates, Switzerland, and Italy.
From this list, the top few are fairly standard. The United States, Canada, and the United Kingdom are all generally going to top the lists. They’re the major English-speaking countries – along with the missing Australia, which is at position number 77 on their list – and they tend to have the most purchasing power for their audiences.
A couple of these entries are a bit of a surprise. Thailand isn’t a country we usually think of as having a lot of money or purchasing power, but within their own sphere of influence, they’re one of the largest available options.
Of course, you can’t exactly harness the purchasing power of Thailand if you can’t publish valuable content in Thai.
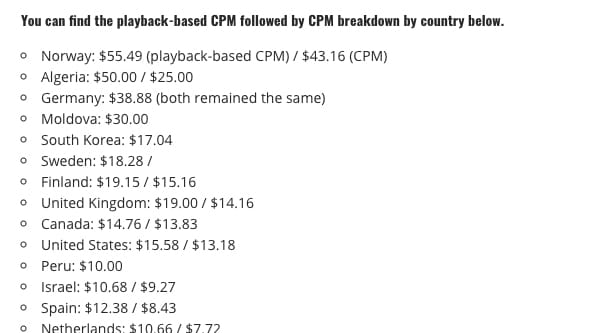
Digital Music News published a rundown of their own CPMs specifically for YouTube advertising. This is a narrow data set, but it does somewhat show the usual trends. It’s also slightly more recent, coming out in August of 2017.
They found average CPM rates to be the highest in Norway, Germany, Moldova, Algeria, and South Korea. When they sorted based on playback-adjusted CPM rates, they got a slightly different list. Norway still tops it, but second is Algeria, with Germany, Moldova, and Finland rounding out the top five.
In one of my own personal small-scale YouTube accounts, I can personally show different numbers. My top five countries based on CPM are Belgium, Finland, the Dominican Republic, Thailand, and Portugal. Adjusting the CPM based on playback shows the same top five, but in a different order: Belgium, Finland, Portugal, the Dominican Republic, and Thailand.
It is, of course, worth noting how little the sample size is here. This test account only has one really popular video, which itself only has around 70,000 views. So, when you see something like Belgium having the highest CPM, that’s true. Belgium, in my analytics dashboard, shows a CPM of $22.97 and a playback-based CPM of $26.25. On the other hand, I only received a lifetime total of 7 monetized playbacks from Belgium, since my content here was focused on an English audience based in the United States. Finland has CPM of $17.59 and playback CPM of $21, but only 31 views. Meanwhile the vast majority of plays came from the United States, Canada, the United Kingdom, Poland, and Australia.
In one major note about YouTube, you can expect the average CPM rates to be rising over the course of the next year. YouTube made a major change to monetization: in order to monetize a channel, that channel needs to have 4,000 hours of watch time on a rolling annual basis, and a total of 1,000 subscribers minimum. This cuts out a huge amount of small channels, which historically aren’t nearly as valuable as the larger channels. Whether this trend holds or whether it collapses into a new normal will remain to be seen.
Moby Affiliates published a data set with a variety of different rates focused on mobile advertising. It’s worth looking into, even if it’s data from 2015 on average.
One section of their data is on Facebook CPM rates. Now, unless you’re part of the Facebook publisher network, you aren’t making money from Facebook ads. However, if you’re part of the Instant Articles userbase or you’re part of the Audience Network, you can get some money. Facebook CPM based on country shows the highest as being Sweden, Denmark, Taiwan, the Netherlands, and Australia. Again, this is specifically for mobile Facebook ad CPM.
Another set of data, from Forrester Research, looked at mobile ad spend. This data shows trends year over year, and shows the United States, China, the United Kingdom, Japan, and Germany at the top. China is trending higher and higher as their market grows and expands, again primarily in the mobile spheres. This is, however, simply ad spend overall, and is not explicitly tied to CPM rates. This is why you see China at the top: they spend a ton of money, but that’s more due to volume than to quality of ads.
Overall Conclusions
I can list off a list of countries with the “highest” CPM payout rates, but honestly the information isn’t going to do you much good. From what I’ve often seen, the best payouts come from the United States, Canada, Australia, and a few European countries like Switzerland, Sweden, the Netherlands, and Germany.
That said, YOUR best CPM rates will depend heavily on where you fall amongst all of those mitigating factors I mentioned up above. The only way to find out is to run ads for a while and then look at your referral data.
 ContentPowered.com


Very good information about cpm