How Long Does Quality Score Take to Update on AdWords?
 ContentPowered.com
AdWords quality score is extremely important, so it’s obviously quite anxiety-inducing when you’re making changes and not seeing any improvement. The culprit is the delay between changing your ads and getting an adjusted quality score. So how long does it take?
The Fast Answer
If you just want to read a quick answer and get out of here, I understand, so here it is: AdWords updates the quality score of your ads on a per-keyword basis about once a day.

However, as with all things in marketing, there are a lot of variables involved, so you aren’t necessarily going to see changes on a daily basis. In fact, it can potentially take much longer.
Quality Score Calculations
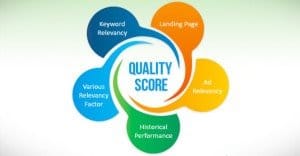
Your AdWords quality score is made up of calculations involving several different factors. In an oddly forward move, Google actually notes down what those factors are.
- Expected Clickthrough Rate
- Ad Relevance
- Landing Page Experience
Additionally, in order to actually calculate your quality score, Google needs to have enough valid information about your ads and their positioning. That means they need impressions. The most commonly cited figure I can find is 1,000 impressions per keyword.
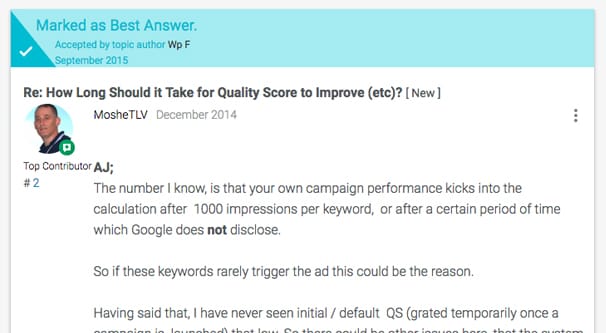
It’s also possible that Google has a time-based delay as well. They try to update every day, but if you aren’t making the minimum threshold for data based on impressions, they will still update eventually. I have been unable to find any specific information, but it doesn’t really matter; if you don’t have enough impressions, your quality score for that keyword is generally going to be null anyways. You would have to have an astonishingly bad ad to get a quality score with low impressions.
Google has also said that they calculate quality score every single time the ad is used in an auction. This can be common or rare depending on the ads, the budgets involved, and other factors, as you might imaging. It’s also simply a declaration of calculation. That is, Google calculates your quality score at every auction, but does not necessarily report that calculation right away or at all. If the calculation does not change your reported score, there’s no reason to report the calculation, so Google skips doing so.
Quality Score Reporting
Google has actually released upgraded, higher quality reporting of quality score data over the last few years. You can see your information more clearly in your ad manager than ever before. They still divide your information amongst the three performance metrics they consider crucial, but they also give you detailed views for each of them. This includes historical data, so you can see how your quality score has been changing over time.
If you want to see how your quality score is doing, you can check it at any time. The method for checking depends on whether you’re using the old AdWords experience or the new version. Currently, if you have a gear icon in the upper right corner, you’re using the old experience. If you have a wrench icon instead, you’re using the new experience.
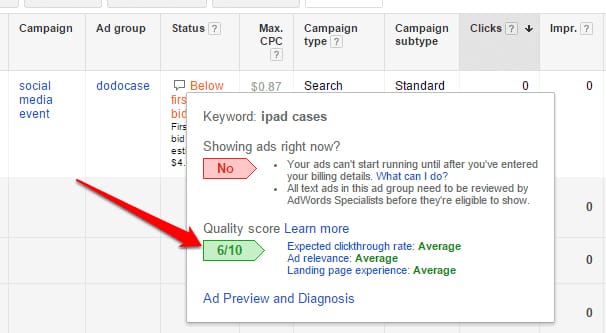
If you’re using the old experience, you can check your quality score by logging into AdWords and clicking the Campaigns section. Select the keywords tab, and then click on the speech bubble next to any keyword to see its status and the details about its quality score.
If you want that view to be present all the time, you can click the columns drop-down menu and choose modify columns. Select quality score to enable it, and choose which of the factors you want to see. You can choose quality score in general or each of the three components, and you can choose historical versions of them as well. Click to apply your changes and the columns will be added to your table report.
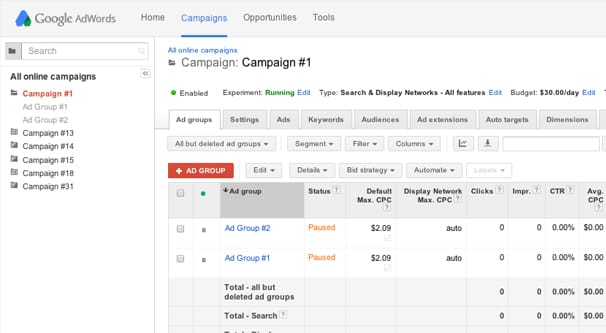
It is, of course, much easier if you’re using the new experience. All you need to do is go to the page menu and click Keywords. From there, you can hover over the status column for any keyword and see the component metrics right there. You can also click on individual keywords to dig deeper into the data, including seeing the historical data.
How Quality Score Factors Work
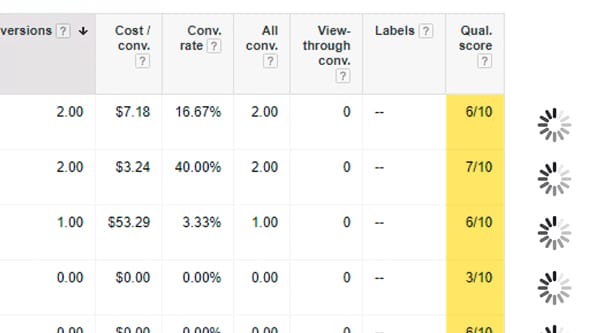
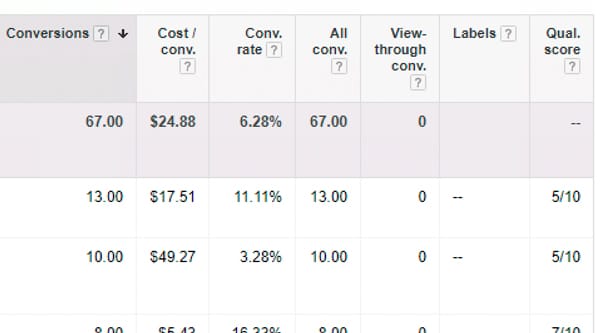
The three factors of quality score are al of equal importance. If you have a – as your quality score, it’s a null score, which means there isn’t enough data to determine what the ad quality should be. Otherwise, you will have a rating of 1-10 for quality score in general, as well as a rating for each individual component.
It’s worth noting that the same keyword for different ads can have different quality scores. If you have two different ads that have identical targeting and identical copy, with the same keywords, but pointing at different landing pages, they can have different quality scores if the landing page experience is significantly different between the two.
Each of the three components of quality score has its own nuance. Let’s go over each of them.
First of all, you have your expected clickthrough rate. The expected clickthrough rate, or ECTR, measures how likely users are to click your ads in Google’s estimation. They used a lot of different factors to make this estimation, but the largest one is simply past performance for similar ads. ECTR is being calculated every time your ad appears in the ad auction, so it can change quite frequently.
 Does Your Conversion Rate Affect Google Ads Quality Score? We all know that Google just freakin'…

ECTR can come in at below average, average, or above average. Below average means that your ad text is probably not very close to your keywords. Average and above average mean you have more of a match between keywords and ads, such that more people are likely to be enticed by those ads.
Crucially, ECTR is different from actual, measured CTR. It’s an adjusted estimate that eliminates the position of the ad as a factor, so things like your budget and your ad location won’t change your quality score.
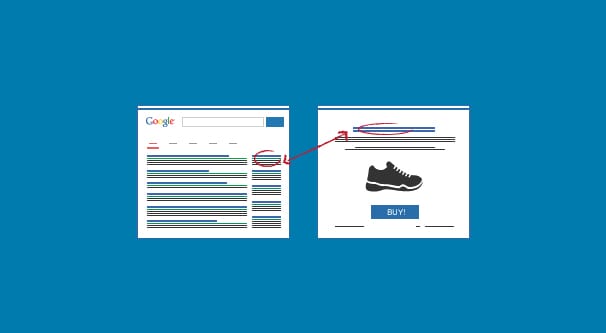
Ad Relevance is the second factor, and describes how well your ads and your keywords match up. If someone searches for striped wool socks, an above average ad relevance would be an ad for striped wool socks. An average ad would be for wool socks or striped socks, and a below average ad would simply be promoting socks in general. The more of a match between the keyword and the ads, the better.
This metric encourages you to make a lot of niche ads instead of a few overarching ads. Rather than having one ad to target all varieties of sock, you should make a bunch of different ads targeting different types, styles, and patterns for socks. Each ad will be narrower and this match more closely with those target keywords. They are also more likely to have less competition, lower costs, and higher clickthrough rates.
The third metric is the landing page experience. Landing page experience is really a very subjective metric, so Google strives to filter out anything that is too subjective from the calculation. This means a wide variety of different landing pages can all be considered “above average” even though some are objectively nicer to experience than others.
Various technical factors go into your landing page experience. For example, being available to mobile users with a well-designed responsive design is better than only having a desktop page. Matching your keywords with the copy on your landing page is very helpful. Additionally, technical errors, redirects, scripts that break, and display errors all can tank your landing page experience.
Some factors do not come into play. Google doesn’t really care if you have an explainer video on your landing page or not, so long as it’s not obnoxiously auto-playing or a broken video player embed. You can gain some benefit from using Schema markup or Google’s AMP system, but they are not necessary and you can still get Above Average without them. Google also does not evaluate the quality of your product or offer; they don’t care if you’re selling something at a 10% markup or at 50% under cost.
Improving Ad Quality Scores
If you want to improve your quality scores in general, there are a lot of little changes you can make. Let’s go over the ones that are likely to have the biggest impact.
First up, it’s generally a good idea to split your ads up into many different ad groups targeting the most narrow keywords you can target that are still likely to be used. The sock example I used above is a good example. One sock store could have different ads for different styles or cuts of sock, for different sock materials, and for different sock patterns. You wouldn’t think there are so many different varieties of socks, but there are, and targeting different sock styles and sock intents can be great.
Note that this will not improve your quality score for a general “sock” keyword. Rather, you stop using that keyword and get assigned new, higher quality scores for each individual narrow sock keyword. Your overall ad quality scores go up on average, and you stop using keywords that don’t have a high quality score.
While you’re thinking about your keywords, you can take the time to prune them out. Monitor how your keywords perform and get rid of any keywords that dramatically underperform. Culling the bad keywords makes your ads work better in general, which means they can have better quality scores where they’re important. Who cares if you have a quality score of 1 or 2 for an ad that only gets 50 impressions in a month? Just ditch that keyword.
When you’re composing your ads, you want to include your keyword in the ad text. Don’t be super bland about it, of course; integrate it with the rest of the copy just like you would in a blog post or in a meta title for a page. Integrating the keyword reinforces that the ad has a narrow application, which boosts your quality score metrics.
Testing multiple ads on a regular basis will help you refine every element of them and help boost your score over time.
You should also make sure your budget is high enough when you run your ads or your ad tests. If you’re not getting at least 1,000 impressions per day, chances are pretty good that you’re not going to have a quickly updating quality score display. You need enough data to see the changes in action.
As far as your landing page experience, you can do a lot to increase quality score from that end of the field as well. As you might expect, a lot of changes are based on SEO best practices. Having a fast-loading site is critically important, as is being able to cater to mobile users. Your content needs to be unique; if you’re using multiple very similar landing pages, split test them appropriately and canonicalize one of them. Promote your site’s transparency and trust as much as possible, and make navigation around your site easy. Avoid broken scripts or media elements, confusing layouts, or anything that can lead to “fat fingering” the wrong link.
Finally, remember that your quality score is always in flux. As you test and change your ads, your quality score may rise and fall. A lower quality score isn’t a death sentence, however! Always keep other factors in mind, like your overall conversion rate and your profit per click. It’s totally fine to have a quality score of 7 instead of 10, if the 7 ad has a better return on investment despite a higher cost.